SUSTAINABILITY REPORT 2022


Table of contents

05 FOREWORD FROM THE CEO 07 THIS IS THE OLAV THON GROUP 14 MATERIALITY AND STRATEGY 25 OUR SUSTAINABILITY WORK 30 CLIMATE AND NATURE 31 Transition to a low-emission society 37 Climate impact 39 Customer preferences 41 Conservation of natural resources and biodiversity 44 CIRCULAR SOLUTIONS 45 Circular habits 49 Circular building solutions 52 SOCIAL JUSTICE 53 Inclusive workplace 60 Human rights, transparency and responsible business practices 64 UN GLOBAL COMPACT 66 GRI INDEX 69 APPENDIX
Foreword from the CEO

All activities have an impact on the environment, people and society –this also applies to us in the Olav Thon Group.
I took over as CEO after Olav Thon in the spring of 2022. It is important to me that our group also becomes part of the solution and that we contribute more to sustainable development in society.
The work on sustainability in the Olav Thon Group has been ongoing for many years, and in autumn 2022 we launched a separate strategy for the sustainability work in the Olav Thon Group. This is a strategy I am proud of because it has long-term ambitions and objectives.
Our sustainability strategy consists of three pillars with long-term ambitions: Climate and nature, Circular solutions and Social justice. Among other things, we will contribute to achieving our ambitions for net zero emissions by 2050, to be nature positive, to have full insight into the value chain and to seek out a representative management.
Although we have set ambitious goals, we are a group with great commitment and emphasis on the long-term nature of our core values. Olav Thon’s vision of being "creative in everything we do" is our guiding star in the work of seeing opportunities and developing solutions to achieve the goals we have set!
During autumn of 2022, we have carried out extensive internal launch work throughout the Olav Thon Group. All our employees were invited to launch celebrations, there have been live broadcasts with our specialist departments in the sustainability area, and we have had guests in the studio. We have also introduced e-learning tools in our follow-up work. Following the internal launch, we work with, among other things, building certifications and development work together with our suppliers.
Many have already started to notice our efforts and commitment to sustainability. We have received recognition in several of our group areas; among others, Thon Hotel Lofoten and Thon Hotel Svolvær received the industry organisation HSMAI’s Sustainability Award 2022 for their extensive work. Ski Storsenter also received the Sustainability Award at the Shopping Centre Conference in Bergen in 2022.
The report you are currently reading has been prepared to highlight the Olav Thon Group’s systematic work on sustainable development.
Happy reading!
Kjetil Nilsen CEO

5
This is the Olav Thon Group
Olav Thon Gruppen AS, and its underlying businesses, is one of Norway’s largest players within the real estate and hotel business. In addition, the group owns and is involved in a number of other businesses.


The purpose of the Olav Thon Group is to help create value, safe workplaces and contribute to the development of safe and good local communities through our business operations. By being creative, we contribute to the development and growth of the local communities in which the business is established. By focusing on well-being, engagement, creativity and trust, our vision is:
About the Olav Thon Group
The Olav Thon Group is a Norwegian real estate player with a portfolio that primarily consists of hotels, shopping centres, commercial properties and housing. The group’s head office is located in Oslo, but the properties are spread throughout Norway, as well as some in Sweden, Brussels and Rotterdam. In 2022, the Olav Thon Group had 1,975 full-time equivalents.
OUR CORE BUSINESS

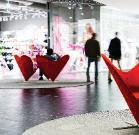
The Olav Thon Group’s history dates back to the 1940s when Olav Thon arrived in Oslo with two red fox pelts. In 1950 he acquired his first property, which is today known as the Arkaden in the centre of Oslo. Since then, the portfolio has grown to include approx. 500 properties, including approx. 80 hotels and over 90 shopping centres. Today, Thon Eiendom and Thon Hotels comprise what can be regarded as the group’s core business.


Thon Eiendom is Olav Thon Group's real estate division and is one of Norway's largest private real estate players. Approx. 500,000 m2 of property are rented out as office premises and high street commercial premises. Here, we have small, medium-sized and large companies as tenants. In addition, Thon Eiendom offers warehouses and logistics buildings, and at three locations in Oslo, you can also rent office communities via the Thon Flex concept.
The group owns and manages shopping centres throughout the country – from Kristiansand in the south to Svalbar in the north – and 10 shopping centres in Sweden. Our shopping centre portfolio is the largest in Norway and has 8 of the 10 largest shopping centres in the country based on turnover.
 Olav Thon was born in Ål in Hallingdal.
The Rainbow Hotels hotel chain is established. In 2005, the name is changed to Thon Hotels.
Buys hotels and proper�es in Brussels.
Olav Thon Eiendomsselskap is established and listed on the stock exchange in 1983.
Buys the former factory premises of Strømmen Stål. Developed into Strømmen Storsenter.
Buys Hotel Bristol in Oslo. Olav Thon buys his first block of flats in Oslo. Today this is the Arkaden shopping centre.
Olav Thon establishes the Olav Thon Founda�on.
The Olav Thon Group establishes shopping centre opera�ons in Sweden.
Olav Thon was born in Ål in Hallingdal.
The Rainbow Hotels hotel chain is established. In 2005, the name is changed to Thon Hotels.
Buys hotels and proper�es in Brussels.
Olav Thon Eiendomsselskap is established and listed on the stock exchange in 1983.
Buys the former factory premises of Strømmen Stål. Developed into Strømmen Storsenter.
Buys Hotel Bristol in Oslo. Olav Thon buys his first block of flats in Oslo. Today this is the Arkaden shopping centre.
Olav Thon establishes the Olav Thon Founda�on.
The Olav Thon Group establishes shopping centre opera�ons in Sweden.
1923
1976 1978 1982 1988 1989 2004 2013 2022
The Olav Thon Group has approx. 80 hotels, approx. 500 proper�es, approx. 90 shopping centres, as well as other businesses.
1950
"We are creative in everything we do"
7
- Olav Thon
Thon Hotels is one of Norway’s largest hotel chains, with approx. 80 hotels in Norway, Brussels and Rotterdam. In 2022, we also opened partner hotels in both Sweden and Denmark. Thon Hotels must be centrally located hotels at a reasonable price. In addition, three values have been formulated to guide and help build a corporate culture: vibrantly engaged, professional hosting and a will to please.
Several restaurants are also included in the Olav Thon Group under the name Resthon. These include places like The Scotsman, Sir Winston, Den Gamle Major and Tostrup Uteservering in Oslo.
OTHER BUSINESSES
The privately owned parking company Time Park AS was started by the Olav Thon Group in 2007. The company offers indoor parking spaces, short-term parking, longterm rental of spaces and charging points for electric cars. Digital solutions such as the ParkLink app and licence plate recognition have been implemented at several car parks.
Unger Fabrikker AS is a chemical industry factory in Fredrikstad that produces and sells surfactants for household detergents, personal care and institutional products. Among other things, the main ingredients are used in washing up liquids, laundry detergents, toilet blocks and shampoo. Unger exports over 90% of what they produce to around 50 different countries. The Olav Thon Group has owned Unger Fabrikker AS since 1992.
Conrad Langaard AS was established in 1854 as a family business and from 1986 became a wholly owned subsidiary of the Olav Thon Group. Business areas are imports, selling of goods, wholesale and logistics services, primarily of tobacco products in addition to imports and sales of snacks and confectionery.
In 2005, the Olav Thon group took over all the shares in Follo Fjernvarme AS. The company produces, distributes and sells district heating and cooling. The company headquarters are located in Ski, where the municipal council has decided that all new buildings and conversions
over 300 square metres must be connected to Follo Fjernvarme. To ensure the Olav Thon Group's properties affordable and environmentally friendly energy, Follo Fjernvarme has also established several district heating plants/local heating systems on the group's properties. The plants use different energy sources for their production.
The Recycling Lottery (Pantelotteriet) was established by the Olav Thon Group in 2008 and is a lottery where empty bottles and cans are used as a stake. The Olav Thon Group owns 60% of Pantelotteriet AS, while the Red Cross owns the remaining 40%. The idea is that the Recycling Lottery will contribute to more recycling and create a lasting source of income for charities.
In 2022, the Red Cross received almost NOK 117 million through the Recycling Lottery. Revenues increased by 4% compared to the previous year. On average, 11% of all empty bottles and cans were used as a stake in the Recycling Lottery. The lottery is now available at over 3,500 lottery machines. In addition, Olav Thon was honoured by the Red Cross President’s plaque for his efforts through the Recycling Lottery. Since it was established in 2008, the Recycling Lottery has provided the Red Cross with more than NOK 650 million.
OUR VALUE CHAIN
The Olav Thon Group is a group with several different business areas. Buying, construction, property rental, hotel and restaurant operations are examples of different areas and activities that in themselves have complex value chains. That is why the Olav Thon Group’s value chain is broad and varied. Below we summarise the main aspects of our value chain concerning our core business. We divide our value chain into three parts: upstream, our own activities and downstream.
Upstream includes the entire supply chain, from when a raw material is extracted from the environment to when a product is delivered to us. There are different degrees of
Upstream Own ac�vi�es Downstream
NATURAL RESOURCES
Ingredients and raw materials are sourced from nature.
Our value chain
PROCESSING
Ingredients and raw materials are treated, processed and converted into a product.
DELIVERY
Our suppliers deliver, possibly buy and sell, the products to us.
DEVELOPMENT
We construct buildings on our proper�es.
processing raw materials in our value chain and therefore also different complexities and distances upstream. In some cases, it only involves the simple processing of the raw material before it is refined into the product delivered to us. In other cases, there are many stages of processing the raw material before the raw material can be converted into a product. There may also be many stages in the actual assembly phase of production.
Own activities consist of own operations on own property. Development and renovation of our properties is carried out, and we have our own operations in various types of buildings.
Downstream includes our customers’ use of the products and services offered by the Olav Thon Group. It consists of everything from hotel guests to customers in our shopping centres and tenants in our rental premises. Downstream consists of different types of customer journeys and different ways of having an impact.
In addition, all waste related to our operations and how this waste is processed is also part of our downstream processes. This applies to waste directly related to our own operations, as well as waste from our guests, customers and tenants.
Ownership and Corporate governance
The Olav Thon Group is a privately owned group owned by the Olav Thon Foundation. The group consists of Thon Holding AS and the listed Olav Thon Eiendomsselskap ASA, which we own 74% of. This includes several subsidiaries, both wholly-owned and partly-owned.
personally and the Olav Thon Group have increasingly been active contributors to creating a better society.
In its management of the Olav Thon Group, the foundation will further develop the business in line with the values, outlook and ideas Olav Thon has based his business operations on.
The foundation will own all the shares in Olav Thon Gruppen AS, which will be domiciled in Norway. The purchase and management of property must be the group's largest business area. A significant part of this activity must take place in Norway. Growth of the business must be striven for. It must be a priority that the group has an unconditionally strong financial position at all times.
The foundation must provide support to promote research and measures aimed at improving the prevention, diagnosis and treatment of musculoskeletal disorders and disorders of the body’s movement apparatus. This can be provided in the form of personal awards for outstanding teaching, which take place at Norwegian educational institutions.
END USERS
Hotel guests and customers visit our hotels and shopping centres, tenants use our premises for their own business.
WASTE
OLAV THON STIFTELSEN (THE OLAV THON FOUNDATION)
RENOVATION
We renovate the buildings when needed.
PROPERTY MANAGEMENT
We operate various types of buildings: hotels, shopping centres and commercial proper�es.
Waste is generated both in our own opera�ons and at our end users. This waste must be further treated.
The Olav Thon Foundation was established in 2013 and at the time of establishment all shares in Olav Thon Gruppen AS were transferred from Olav Thon. The purpose of the Olaf Thon Foundation is to exercise stable and long-term ownership of Olav Thon Gruppen AS and its underlying organisations in accordance with the business management principles adopted by Olav Thon, as well as to distribute funds for non-profit purposes.
Throughout his work, Olav Thon has aimed to create value and establish safe workplaces and the idea is that the Olav Thon Foundation will continue this long-term. Olav Thon
Furthermore, support must be provided both for general charitable causes and for the construction of real estate for use by charitable causes in Norway. Funding may also be provided to Olav Thons Legat, provided that this foundation has charitable causes.
CORPORATE GOVERNANCE
The management of the group falls under the group board. The board must ensure the responsible organisation of the business and must, to the necessary extent, establish plans and budgets for its business. The board may also establish guidelines for the business. The board is elected by the general meeting and consists of seven members.
The CEO/General Manager of Olav Thon Gruppen AS represents the day-to-day management of the group’s activities and must follow the guidelines and instructions issued by the board. The daily management does not
Olav Thon S��elsen (the Olav Thon Founda�on)
Thon
ASA Thon Eiendomsdri� AS Thon Hotels AS Amfi Eiendom AS 100% 100% 100% 100% 100% 74% CORPORATE STRUCTURE
Olav Thon Gruppen AS
Holding AS Olav Thon Eiendomsselskap
9 8
include matters that, according to the company’s conditions, are of an unusual nature or of great importance.
The Olav Thon Group’s corporate management consists of six group directors, each with responsibility for their own professional and business areas. These professional and business areas include real estate, hotels and restaurants, finance, business management, technical, and HR, organisation and administration.
CONFLICTS OF INTEREST
In order to reduce and prevent conflicts of interest, it is stipulated in contracts and job descriptions, as well as other governing documents, that involvement in other activities that may be considered to be competitive or similar, directly or indirectly, is not permitted. In addition, we have a standing order that all other connections to companies outside the Olav Thon Group must be reported to the immediate manager, who will then assess whether further measures are needed. In 2023, a clearer policy will be drawn up.
GUIDELINES FOR REMUNERATION
The majority of our companies’ boards are unpaid. Currently, there are around ten companies with board fees. Remuneration for the boards that have been adopted by the general meeting.
WHISTLEBLOWING
In the Olav Thon Group it is encouraged to report misconduct, as this may help to ensure that the
Group management
OLAV THON Chairman D.o.b.: 1923
conditions can be rectified. It is desirable that this is primarily done internally. Internal reports can be made to the line manager, a manager higher up in the line, a safety representative or employee representative. Our whistleblowing channel is available to parties wishing to remain anonymous or who are not an employee of the group. The Olav Thon Group has chosen to use an external party to receive reports through the whistleblowing channel to safeguard any desired anonymity. The Executive Vice President for HR, Organisation and Administration and HSE manager receive the reports and assess who is responsible for following up the individual whistleblowing case.
The Olav Thon Group has produced a notice about whistleblowing, describing what whistleblowing is, the options and rights of a whistleblower, and what happens when a report is made. A procedure has also been drawn up describing what someone wishing to make a report needs to do. In 2022, one report came in through our whistleblowing channel. Whistleblowing cases may also have been raised directly with the HR or HSE department, but we do not have any figures at this time.
The Olav Thon Group also uses various systems for reporting and handling non-conformities within different fields. Non-conformities within safety, fire, privacy and HSE are reported here. Non-conformities can take different forms and do not have to concern unacceptable circumstances.
ARNE B. SPERRE
Executive Vice President – economy and finance
D.o.b.: 1962
Arne B. Sperre holds a Master's degree in Economics and Business Administration from the BI Norwegian Business School. Sperre has been employed by the Olav Thon Group since 1997 and since 2014 as a member of the group management. Sperre came to the Olav Thon Group from a position as assistant bank manager at DNB. Sperre holds a number of board positions, and is a board member of the Olav Thon Foundation, Thon Holding AS, Olav Thon Gruppen AS and Thon Hotels AS.
DAG TANGEVALD-JENSEN
Executive Vice President – corporate governance
D.o.b.: 1960
Dag Tangevald-Jensen holds a Master of Science degree in Economics from Copenhagen Business School. He has held various senior positions within the Olav Thon Group since 1990 and has been a member of group management since 1992. Dag Tangevald-Jensen holds a number of board positions and other positions of trust, including member of the board of the Olav Thon Foundation and Handelsbanken Norge. He is also the CEO of Olav Thon Eiendomsselskap ASA, as well as the deputy chairman of the board of Olav Thon Gruppen AS.
MORTEN THORVALDSEN
Executive Vice President – hotel and restaurant
D.o.b.: 1957
Morten Thorvaldsen is CEO of the Olav Thon Group’s hotel chain Thon Hotels, a position he has held since 1989. Thorvaldsen received hospitality industry’s honorary award 2023 and the Grand Travel Awards' honorary award 2022. He is vice president and board member of NHO Reiseliv and also a member of the board of the European umbrella organisation for hotels, restaurants and cafes, HOTREC. In 2017, Thorvaldsen was appointed an honorary member of the prestigious hotel school, Cornell University.


Olav Thon is the founder of Olav Thon Gruppen AS and has been the group’s chairman since it was established in the 1940s. From the 1940s, he ran an extensive business, which is now part of the Olav Thon Group and Norway’s leading player within the real estate and hotel business.

In December 2013, the Olav Thon Foundation was established, and all shares in Olav Thon Gruppen AS were gifted by Thon to the foundation. Olav Thon is the chairman of the Olav Thon Group AS and is also chairman of the board of the Olav Thon Foundation, Olav Thon Eiendomsselskap ASA and Thon Holding AS.
KJETIL NILSEN
CEO and Executive Vice President – technical
D.o.b.: 1966
Kjetil Nilsen has been employed by the Olav Thon Group in various management positions within project management since 1995. He took over as CEO on 1 May 2022 after Olav Thon announced his resignation. Kjetil Nilsen is also a board member of the Olav Thon Foundation and deputy member of Olav Thon Eiendomsselskap ASA.
ANNETTE HOFGAARD
Executive Vice President - real estate
D.o.b.: 1975
Annette Hofgaard is a state-authorised real estate agent and business economist from the BI Norwegian Business School. Annette Hofgaard has been with the Olav Thon Group since 2004, and became the group director of real estate in 2022, after having been the director of commercial real estate for a number of years. Annette Hofgaard is also a board member of the Olav Thon Foundation and Olav Thon Gruppen AS.

GEIR THORVALDSEN
Executive Vice President – HR, organisation and administration
D.o.b.: 1968
Geir Tore Thorvaldsen has a business education and marketing management from the BI Norwegian Business School. He is also educated at the Royal Norwegian Air Forces’ officer training school and is also a certified performance coach from the University of Agder. Thorvaldsen has held senior positions in the Olav Thon Group within HR since 1998, and in 2022 he became group director HR and a member of the group management. Thorvaldsen is CEO of the Olav Thon Foundation, chairman of Amfi Kreativ AS and board member of a number of other companies.
11 10
Financial social contribution
The Olav Thon Group is a commercial player and turnover and profit are important focus areas in day-to-day operations. The economic aspect also involves a contribution to society, in the form of taxes and fees, employees' salaries and benefits and investments in expanding the business, which in turn leads to new jobs.
Anti-corruption and security
At Olav Thon Eiendomsselskap we follow the Olav Thon Group’s security work. This involves the security of both people and equipment. In 2022, the coronavirus pandemic continued to affect our security and emergency response work. We train and work actively with digital attacks.
RISK ASSESSMENT
The Olav Thon Group did not experience any particular changes in the risk picture in 2022 compared with 2021. The number of ordinary incidents such as burglary and vandalism has remained at a consistently low level. The Olav Thon Group’s IT department, on the other hand, has been experiencing high numbers of cyber threats. Several of these involved digital fraud in which our brand names were copied or abused. Olav Thon’s name has also been actively used in false advertising.
Since the pandemic, we have been experiencing a return to higher crime figures at our shopping centres. This is largely related to itinerant criminals who steal for large sums of money over a few days and then move on.
ANTI-CORRUPTION
As part of the group's security work, we work systematically with anti-corruption. We offer courses in how to detect and deal with embezzlement; the head of security conducts an annual overall review with the auditor to assess embezzlement and corruption in the past year; we have clear processes for cash sales; and a check of cash and card sales is carried out each year.
REVENUE AND PROFIT
The Olav Thon Group had NOK 12,185 million in operating revenues in 2022 and the financial values retained in the company were NOK 2,992 million. The financial values retained in the company are invested in expansion and improvements of the business in accordance with the articles of association of the Olav Thon Foundation.
FINANCIAL SOCIAL CONTRIBUTION
The group's financial contribution to society is divided into several factors. These are categorised in accordance with
GRI Standards. The operating costs are an indirect socioeconomic contribution to other Norwegian companies having income from the sale of their goods and services. A more direct contribution is the payment of employees' salaries and benefits. In 2022, the Olav Thon Group paid NOK 1,745 million in salaries and benefits to employees. This affects the national economy by contributing to the individual employee's personal finances, maintaining the purchasing power of our employees and that these contribute by paying taxes and fees to society. The Olav Thon Group is also a direct contributor to society through the payment of taxes and fees. In addition, the financial values created in the company are retained, where they are used to expand the businesses. This is done in accordance with the Olav Thon Foundation's articles of association and contributes to creating jobs and values for Norwegian society.
The Olav Thon Group also contributes with investments in society. When we have construction projects, we will in some cases make improvements in public areas/ installations around the construction project. This can be planting trees, establishing new pavements or similar. Through those who pledge their contribution to the Recycling Lottery, funds are paid to the Red Cross' work locally and centrally. In 2021, the Olav Thon Group invested a total of NOK 193 million in society.
In addition to investments in society, funds are paid from the Olav Thon Foundation to charitable causes including scientific research. This payment is financed by dividends from the Olav Thon Group to the Olav Thon Foundation.
Further explanation of financial figures can be found in the appendix (page 69).
EMERGENCY DRILLS
The Olav Thon Group has a central emergency response team that handles incidents when support is needed at the operating units. In 2022, the emergency response team focused on handling digital threats alongside other threats.
EMERGENCY RESPONSE INCIDENTS
As a major business player, the Olav Thon Group occasionally experiences incidents of a different security nature. The risk and threat situation within the Olav Thon Group is considered to be at an acceptable level and has not changed significantly since 2018. However, we experienced several serious incidents on our properties in 2022 of various kinds, which are to be expected for a business of the Olav Thon Group's size and nature:
• Fire at a Thon Hotel in Brussels
• Two fires involving tenants in our commercial premises
• Some minor fires in waste bins and electrical installations
• Riots in Sweden, which meant that we had to close down a shopping centre twice
• Discovery of explosives/bomb outside a shopping centre in Sweden
• One of our hotels was heavily involved in the shooting and handling of casualties in connection with Pride on 25 July 2022
• Murder in a parking garage at a shopping centre
• Armed threats against guards
• Burning of the Koran outside a shopping centre
• Some burglaries at shops in our shopping centres
• Falls on stairs and in doorways
• Wind blowing down large signs in the car parking outside a shopping centre
• Several large incidents of water damage due to rain or burst pipes
Embezzlement of cash is mainly revealed through control and follow-up, which emphasises the importance of clear, controlled procedures. Control also involves cooperating with banks and reporting of suspicious activity. As cash becomes scarcer, we are seeing a tendency among some parties to try and appropriate money through goods or by correcting transactions so they are converted into money, which is then appropriated.
Incidents among our tenants are followed up, and if necessary we cooperate with the police. This helps us to identify weaknesses so that we can draw up new procedures.
We send out an annual supplier survey to our contract suppliers. Among other things, it includes questions about anti-corruption. The suppliers were asked about their experience with the Olav Thon Group with regard to rules, corruption and embezzlement. None of our suppliers reported experiencing pressure in connection with this in 2022.
We have found that reports of theft and other crimes on our properties are largely dropped. This is problematic, as these cases account for losses of large amounts. Once dropped, it is difficult to get compensation. In addition, if cases are continuously dropped, perpetrators will carry on committing such offences on our properties, since there are no consequences.
THE DIGITAL THREAT
The digital threat has continued to increase and we experienced an increasing number of attacks on our users and systems in 2022 as well. The new hybrid working day and new online solutions are two of the most important challenges for maintaining IT security this year. The attacks are becoming more advanced and this trend is continuing. In 2022, the group's IT department worked on 1773 cases related to IT security. By comparison, there were 623 cases in 2021. One of the reasons this has increased is that the number of records we receive is growing, parts of our infrastructure have changed and new IT systems have been implemented.
Category 2021 2020 Revenue Opera�ng costs Employee salaries and benefits Payment to suppliers of capital Payments to authori�es Investments in society 10,283 4,496 1,338 1,136 490 165 8,995 3,872 1,275 1,059 301 142 Amount in MNOK 10,413 4,678 1,716 1,215 412 84 2019 2018 11,041 5,261 1,591 1,563 508 71 Financial values retained in the company 2,659 2,346 2,308 2,048 2022 12,185 5,345 1,745 1,345 564 193 2,992 Employee salaries and benefits Opera�ng costs Payment to suppliers of capital Payments to authori�es Investments in society Percent EXPENSES 19% 58% 15% 6% 2%
13 12
Materiality and strategy
In 2021, the Olav Thon Group started a project to develop a proposal for a sustainability strategy. The strategy was finalised, dealt with by the board and launched in 2022. It will be a guide for how the group works with sustainability until 2030.
The Olav Thon Group’s sustainability strategy is based on a double materiality analysis. Materiality has always been the basis for where the group has focused its sustainability work and has been central to the group’s sustainability reporting. The group’s first materiality analysis was carried out in 2013 to identify which topics were most significant and relevant for the group to report on at that time. Since then it has been revised once in 2016/2017, and now we have carried out a new double materiality analysis in 2021/2022.
A double materiality analysis looks at both how the Olav Thon Group affects the climate, the environment and people, and how the outside world affects the group. The following sub-chapters describe how the group conducted a double materiality analysis by means of an impact analysis and a stakeholder and megatrend analysis. The result of the analysis revealed the important topics that laid the foundation for the sustainability strategy. We will continue working on the strategy until 2030.
Impact analysis Stakeholder and megatrend analysis
Impact analysis
In 2022, an impact analysis was carried out that looked at the Olav Thon Group’s impact on the climate, environment and people through the group’s activities. A survey was carried out of all the group’s business areas, both core activities and more peripheral activities. An impact analysis of the entire value chain was carried out for the most significant business areas (property, hotel and shopping centre). This was to reflect the group’s activities as best as possible.
The impacts were grouped into two main categories: climate and environment, and people. The categories were the grouped into sub-categories, inspired by relevant frameworks such as GRI 1, SASB 2, TNFD 3 and WEF 4, to structure their impacts.
IDENTIFICATION OF IMPACTS
Relevant documents such as the sustainability report, carbon accounting report, waste reports, spend reports, supplier surveys, policies and guidelines were reviewed to identify various impacts the group has on the climate, environment and people. As part of the impact analysis, a literature analysis was carried out by sector supervisors, similar companies and others at the same sector level to identify potential impacts in the value chain. A sector analysis was carried out based on an overview from SASB and TNFD of the topics that are relevant to the respective sectors in which we operate.
The identified impacts were discussed with a reference group representing all different specialist and business areas in the group. The reference group also had the opportunity to provide input on other influences that may not have been identified. This was done through interviews.
IMPACT ASSESSMENT
The impacts were assessed as having either high, medium or low impact, in a negative or positive sense, through both a qualitative and quantitative approach. Most data was available in the part of the value chain covering the company's own activities. Upstream and downstream were therefore largely based on general information about the sector, reports and assumptions. This was done in an attempt to create a picture of the entire value chain. The impacts and occurrence of the impacts were seen in relation to the group’s operations and turnover. The assessment of the impacts was discussed and established through interviews with the reference group, as well as group management.
The illustration below shows an overall picture of the results with the most important impacts we have on the climate and the environment, as well as people, through our value chain. The full result can be found in the Materiality Analysis document, which is available on the Olav Thon Group’s website
Impact on people and the environment Risks and opportuni�es Social and environmental importance Financial materiality ...and the consequence of their ac�vi�es Informa�on needed to understand the company’s development, results and posi�on... The company’s impact on people, the environment and the climate Company People and the environment Climate change and people have an impact on the company Company People and the environment The company’s impact on human rights and climate change can be of financial significance
Property
Tenant/end user Hotel guest Upstream Own ac�vi�es Downstream Climate and environment Emissions from building materials Emissions from construc�on sites Emissions from the opera�on of buildings Emissions from the customer’s journey Water and chemical consump�on Energy consump�on in shopping centres Water consump�on Material consump�on Reuse of materials Frequent interior changes Waste management Waste management Sor�ng rate Energy consump�on in shopping centres Food waste Natural interven�on Deple�on of nature Plan�ng of areas Social condi�ons Diversity and Inclusion Equality Equality HSE Local value crea�on Decent working condi�ons and human rights Decent working condi�ons and human rights Decent working condi�ons Local value crea�on Privacy Policy HSE Create mee�ng places Skills development Privacy Policy HSE An�-corrup�on Local value crea�on Privacy Policy IT security HSE Medium nega�ve impact High nega�ve impact Medium posi�ve impact High posi�ve impact 14 15
The
supply chain Development and renova�on
management
Stakeholder and megatrend analysis
In order to identify the impacts that climate, environment and people have on the Olav Thon Group, a stakeholder analysis and a megatrend analysis were carried out.
STAKEHOLDER ANALYSIS
The stakeholder analysis helped us identify which topics our key stakeholders are most concerned with. The analysis had both a present and a future perspective. The group’s prioritised stakeholders for this purpose are employees, the financial sector, tenants, end users and hotel guests, authorities, suppliers and local communities.
A desktop analysis was conducted to identify the expectations our stakeholders have of our sustainability work. In addition, dialogues with employees and supplier surveys have helped identify what is important to them.
EMPLOYEES
Our employees are very important to the group as we rely on their expertise and commitment to create results. Young applicants and the younger generation of employees are finding sustainable companies increasingly attractive. In addition, expectations for an inclusive workplace, skills development and development opportunities are becoming increasingly higher.
FINANCIAL SECTOR
We depend on the financial sector to finance our operations. Investors and banks have a growing interest in sustainability and are placing requirements on information and reporting. The pending EU taxonomy is an example of how, in the future, financing terms can be agreed if sustainable activities can be documented.
TENANTS, END USERS AND HOTEL GUESTS
There has been a change in preferences and an increase in awareness among our end users, tenants and hotel guests in terms of sustainability requirements. End users want complete product information, which the implementation of the Norwegian Transparency Act shows. Surveys also show that location is no longer the most important factor for commercial property tenants. There are also more people wanting climateneutral travel, and hotel guests are increasingly demanding environmental profiles at hotels.
SUPPLIERS
More openness and transparency in the supply chains makes actual conditions in the value chain more visible. Production workers get a bigger voice and suppliers are more able to demand fair pricing for their products. Technological development and the digitisation of trade are also increasing traceability in the value chain, and consequently transparency.
AUTHORITIES
With the increase in requirements for waste management, circularity, emission cuts, openness, transparency and so on, it is becoming more notable how authorities are holding companies accountable in sustainability matters. There has been a constant stream of new requirements for information and reporting, as well as sustainable activities.
LOCAL COMMUNITIES
Through the development and operation of properties and hotels, we have a large presence in local communities. This creates expectations for contributions to good local environments and urban spaces, low pollution and general consideration of the surroundings. In addition, there is a strong focus on companies’ impact on indigenous peoples and minorities.
MEGATREND ANALYSIS
As part of the work on the sustainability strategy, a megatrend analysis has been carried out to provide an overview of the Olav Thon Group’s risks and opportunities in relation to key megatrends. Five relevant megatrends were identified: climate change, a transition to a circular economy, a transition to the conservation of nature and biodiversity, digital transformation, and a transition to social justice. These were analysed in the light of three different transition scenarios; fast, slow and no transition.
Furthermore, the group’s significant risks and opportunities in relation to the megatrends were identified through interviews with a reference group in the group. Workshops were held with all business and specialist areas represented. In these workshops, the risks and opportunities were assessed as having low, medium or high impact and probability based on the different transition scenarios.
The risk matrix below shows the results from the workshops:
1. Limited and a change in the availability of goods
2. Climate-related customer preferences
3. Climate-related regulatory changes
4. Climate-related damage to buildings and property
5. Energy transition
6. Consumers wanting to shop less and buy more secondhand
7. Regulatory requirements for circular solutions in buildings
8. Regulatory requirements for waste management
9. Regulatory requirements for circular design and repair
10. Regulations for the preservation of natural resources, biodiversity and ecosystems
11. Nature-related preferences for travel and tourism
12. Nature-positive building solutions
13. Changing consumer habits due to digitisation
14. Traceability in the value chain
15. Disruptive technological business models
16. More regulatory requirements for human rights in the supply chain
17. Information on responsible business practices
18. Requirements for transparency in equality and diversity in business and management
19. Inclusive and developing workplace
Consequence Probability L M H L M H 9 6 11 12 15 2 14 10 17 19 4 1 3 13 5 7 18 8 16
16 17
After the workshops, it became clear that all risks and opportunities were considered important. An assessment was therefore made where we weighed the results for the various themes against relevance and materiality in relation to the Olav Thon Group’s operations.
No detailed analyses of the risk areas have been carried out per property, and it is therefore too early to determine whether climate risk should be taken into account when determining the fair value of the property portfolio.
Find out more about the megatrend analysis in the Materiality Analysisdocument on the Olav Thon Group’s website at olavthon.no
Our sustainability strategy
The Olav Thon Group’s sustainability strategy defines what the group must do and achieve by 2030. The strategy means we must be much more ambitious and put considerably more effort into the sustainability work in the organisation. We must be ambitious in our goals to contribute to sustainable development in society. We do this to ensure value in a long-term perspective, while at the same time being creative in the work we do today.
THE STRATEGY PROCESS
In 2021, it was decided by the group management of the Olav Thon Group draw up a proposal for a sustainability strategy. The decision was taken based on a desire for the Olav Thon Group to contribute more to sustainable development. In addition, there has been greater expectation from society for the business community to contribute to sustainable development.
At the end of 2021, a project was launched to draw up a proposal for a sustainability strategy, with the initiation of a double materiality analysis, which was described earlier in the report. To ensure the strategy was firmly established across all the group’s business areas, a reference group was created with representatives from the various specialist and business areas in the group. The reference group was involved through interviews and workshops. Group management has been involved the whole way from start to finish, through interviews, own workshops and regular update meetings.
As mentioned, the strategy is based on a double materiality analysis, i.e. an analysis of the group’s impact on people and the environment, as well as the impact of the outside world on the group. Based on workshops and interviews in the reference group, as well as group management, we defined nine significant topics within three different pillars, which constitute the group’s sustainability strategy.
As part of the project, a maturity assessment was also carried out by the Olav Thon Group to see how mature the group’s governance is on sustainability-related topics.
The assessment was made in order to obtain a good picture of the current situation and better identify the realistic goals and measures. Maturity was at that time assessed as medium5 to low6. In assessing the level of the Olav Thon Group's ambition within the field of sustainability, it became clear that we want to be a committed player in sustainable development, and will therefore have goals, measures and ambitions that reflect this. The Olav Thon Group believes that sustainability is the right and smart way to go and will proactively engage customers and suppliers to achieve sustainability goals.
Measures and goals have been drawn up to help us on our way to achieving our ambitions. As part of the project, a list of proposed goals and measures related to each important topic was drawn up, which were assessed as compliant 7, low hanging fruit 8, must win battle 9 or bold move 10. Roadmaps related to each pillar were developed through workshops with group management, as well as advice from the relevant specialist departments.
The sustainability strategy is anchored in the board of Olav Thon Gruppen AS and applies to all companies in the group. The strategy was adopted by the board in June 2022 and was launched in the second half of 2022.
The group management of the Olav Thon Group has overall responsibility for achieving the goals in accordance with the strategy. The various operating units are responsible for implementing the necessary measures. The different specialist departments in the Olav Thon Group are technically responsible for their areas. The sustainability team in the Olav Thon Group has overall
responsibility and follows up on the group’s various departments, as well as group management. They provide advice where necessary throughout the year to ensure progression at all stages. Group management has monthly status meetings with the sustainability team, which reports on the status of the sustainability work. This is to ensure measures are handled effectively and that group management is kept up to date on the topic. In addition, the sustainability team provides group management with a quarterly status on the achievement of goals in accordance with the strategy and an annual status on the previous reporting year. Through regular status meetings, group management is able to continuously evaluate the sustainability work, the group’s impact, and our progress.
STRATEGY
The Olav Thon Group’s sustainability strategy consists of three pillars: climate and nature, circular solutions and social justice. Long-term ambitions have been defined
for the various pillars. The pillars each have their own key topics, goals for 2030 and sub-goals along the way, which build on the long-term ambitions.
Within each pillar there are several material topics. These are the topics identified through the double materiality analysis. Each topic is described in the following chapters. This describes the definition and scope of the topics, as well as how they relate to the Olav Thon Group’s operations.
Roadmaps have also been created for each topic. The roadmaps illustrate the path we must take, the measures we need to take and the sub-goals that need to be achieved in order for us to achieve our main goals by 2030. Goals and sub-goals have been set for 2023, 2025 and 2027. The sub-goals will help us to continuously progress towards our long-term goals by 2030. These goals will further contribute to achieving the longer-term
Pillars Material topics Indicator Goals 2023 Goals 2030 Ambi�on
Transi�on to a low-emission society
Climate impact
Climate and nature
Customer preferences
Conserva�on of natural resources and biodiversity
Circular habits
Circular solu�ons
Number of tCO2e
Se�ng SBT for own emissions and defining a baseline
Map climate risk in own opera�ons
Propor�on of locally sourced food/drinks (%)
Percentage of proper�es with green areas (%)
Sor�ng rate (sorted/total waste)
Circular buildings
Reuse rate (reused material/total material)
Inclusive workplace
Gender balance in managerial posi�ons (%)
Human rights and transparency
1 Means that the company has some maturity in its governance, but with room for improvement
2 Means that there are few or no forms of governance in place
3 Actions to be taken due to regulations
4 Requires little effort but can have a high impact
5 Strategically important and must be done to stay engaged on an ambition level
6 Precursors: high effort, high profit, strategically relevant, but with a certain risk
Responsible business prac�ces in the
20% of all food and drink must be locally sourced
60% reduc�on in own emissions (scope 1 and 2) Net zero by 2050
Report climate risk in accordance with TCFD by 2025 Net zero by 2050
70% of all food and drink must be locally sourced Nature posi�ve
Green areas/pocket forests for all new buildings Green areas on 60% of exis�ng proper�es Nature posi�ve
Require hotels and tenants to commit to a 60% sor�ng rate
70% sor�ng rate at hotels and shopping centres 70% circular by 2030
Map current poten�al for use of recirculated materials in construc�on projects
Reuse rate in building projects in line with the EU taxonomy for climate (90%)
70% circular by 2030
Strategy for equality, inclusion and diversity
Ethical purchasing requirements in line with the Norwegian Transparency Act
40% of each gender overall and on management levels 1–3
Report on transparency, diversity and inclusion from 2027
Representa�ve management
Full insight into the value chain
jus�ce
Social
-
value chain Number of supply chains mapped Supply chain mapping for 1–3 of
categories Supply chain mapping for 100% of
categories Full insight into the value
product
product
chain
18 19
ambitions. While the goals of the strategy are concrete and measurable, the ambitions are something the group must strive towards in our sustainability work. Some of the ambitions extend to 2030, while others are planned right through to 2050.
The illustration above shows the main features of the strategy. It indicates all the key topics related to the key goals for 2023 and 2030, the core indicators for measuring progress, as well as the long-term ambitions. Going forward, we will continue to work on implementing the strategy and expanding our sustainability work. As
UN Sustainability Goals
mentioned, group management will be kept up to date on its status, and we will report on the achievement of goals internally and externally in accordance with the strategy on an annual basis. This will then be primarily set out in our annual sustainability report. We expect the group to undergo a number of changes in order to achieve its goals, particularly with regard to routines and procedures. It takes time to adapt, and we therefore also have a long-term perspective on what the Olav Thon Group’s sustainability work and system should look like.
OUR CONTRIBUTION
Through systematic work with a focus on energy efficiency improvement and optimisation, the Olav Thon Group will contribute to SDG 7 – clean energy for everyone. The operation of property involves high energy consumption, which gives us the opportunity to influence energy production and access. The Olav Thon Group wants to contribute to an increased share of renewable energy at a global level by establishing renewable production at its own properties. In addition, we want to reduce our energy consumption so that more people have access to energy.
Pillar: Climate and environment
Key topic: Transition to a low-emission society
Action: Map renewable production on properties, energy label A on all new builds, purchase guarantees of origin for electricity consumption, BREEAM certification of buildings, renovations in accordance with the EU taxonomy criteria for climate, reduction in emissions in scopes 1 and 2.
UN sub-goals:
• 7.2 By 2030, significantly increase the share of renewable energy of the world’s total energy consumption
• 7.3 By 2030, make the improvement in energy efficiency worldwide go twice as fast.
As a member of the UN Global Compact, the Olav Thon Group wants to contribute to achievement of the UN’s sustainability goals for 2030 by minimising the negative, as well as increasing the positive impact on these. The Olav Thon Group is a group with many suppliers, customers and employees. It is a cornerstone company and operations developer and can contribute in several ways.
PRIORITISED SUSTAINABILITY GOALS
The Olav Thon Group is of the opinion that in order to create an actual contribution to the UN agenda for 2030 and the sustainability goals, it is essential to point out the most relevant goals that the group can contribute to achieving. In 2019, a project was carried out to identify the most relevant. In 2022, the sustainability goals were revised in accordance with the strategy to have a clearer link between significant topics, action and the sustainability goals. The strategy will also lead to a clearer operationalisation and a more concrete and clearer contribution to the goals.
A prioritised sustainability goal is linked to each pillar of the strategy. This goal is what we consider most important for each pillar. Climate and nature and social justice also have other relevant sustainability goals linked to them. For each goal, sub-goals have also been identified that we want to focus on in our work with the sustainability goals. All the subgoals are linked to goals in the strategy. A sustainability goal can be linked to several of our goals, also across the pillars.
OUR CONTRIBUTION
Through our work on equality, inclusion and diversity, as well as human rights and transparency in the value chain, the Olav Thon Group will contribute to SDG 8 – decent work and economic growth. We respect human and workers rights and will actively work to gain full insight into the value chain and ensure compliance with our requirements for equal pay for equal work, the abolition of forced labour and child labour, the protection of workers rights and safe working environments.
OUR CONTRIBUTION
Through our work on equality, inclusion and diversity, the Olav Thon Group will contribute to SDG 5 – gender equality. Despite a relatively good distribution between women and men in the group, this is considered as an important topic that we must continue to work on. Currently we only have one woman in the group management and the board. We want to achieve a representative leadership, and through our work on equality, inclusion and diversity we want to ensure that women have real participation and equal opportunities for senior positions as men. Going forward, we will make strategic choices to ensure that we safeguard and develop diversity within the group.
Pillar: Social justice
Key topic: Inclusive workplace, responsible business practices in the value chain and human rights and transparency
Action: Conduct risk assessment, map the supply chain to product categories, ethical purchasing strategy and procedures, report on transparency, diversity and equality
UN sub-goals:
• 8.5 By 2030, achieve full and productive employment and decent work for all women and men, including young people and people with disabilities, and achieve equal pay for equal work.
• 8.7 Take immediate and effective action to abolish forced labour, end modern slavery and human trafficking and ensure that the worst forms of child labour – including the recruitment and use of child soldiers – are prohibited and abolished, and by 2025 abolish all forms of child labour.
• 8.8 Protecting workers rights and promoting a safe and secure working environment for all workers, including migrant workers and especially female immigrants, and workers in an unsafe working environment.
• 8.9 Before 2030, develop and implement policies to promote a sustainable tourism industry that creates jobs and promotes local culture and products.
Pillar: Social justice
Key topic: Inclusive workplace and human rights and transparency
Action: Establish a working group and create a strategy for equality, inclusion and diversity, achieve 40% of women in total and in management levels 1-3, as well as on the board of the Olav Thon Group.
UN sub-goals:
• 5.1 End all forms of discrimination against girls and women around the world
• 5.5 Ensure women's full and real participation and equal opportunities for leading positions at all levels where decisions are made, in political, economic and public life
OUR CONTRIBUTION
Through our renovation and development projects, the Olav Thon Group will contribute to SDG 9 – industry, innovation and infrastructure. As a major real estate player, the Olav Thon Group wants to develop reliable, sustainable and solid buildings. Through renovations in accordance with the EU taxonomy criteria for climate, we will work to upgrade our properties to become more sustainable. We will focus on more efficient use of resources by increasing the degree of reused materials in buildings. The Olav Thon Group wants to be part of a sustainable transformation in business and industry.
20 21
Pillar: Climate and nature, and circular solutions
Key topic: Transitioning to a low-emission society, climate impact, circular habits and circular buildings
Action: renovations in accordance with the EU taxonomy criteria for climate, BREEAM certification of buildings, developing green areas, roofs and walls on 60% of existing properties, green areas/pocket forests on all new buildings, recycling rate of non-hazardous waste in construction projects must be 90% and rate of recycled materials in line with the EU taxonomy (30%)
UN sub-goals:
• 9.1 Develop reliable, sustainable and robust highquality infrastructure, including regional and cross-border infrastructure, to support economic development and quality of life with an emphasis on affordability and equal access for all
• 9.4 By 2030, upgrade infrastructure and transform the business to become more sustainable, with more efficient use of resources and more extensive use of clean and environmentally friendly technology processes, where all countries make an effort according to their own ability and capacity
OUR CONTRIBUTION
By focusing on waste management and the use of recycled materials, the Olav Thon Group will contribute to SDG 12 – responsible consumption and production. Large amounts of materials go into the construction and renovation of properties, as well as a lot of waste resulting from the operation of the properties. The Olav Thon Group therefore wants to focus on what the business of building materials and other raw materials involves, as well as focus on waste management and food waste. This will help us achieve sustainable management and efficient use of natural resources by 2030.
Pillar: Climate and environment and circular solutions
Key topic: Customer preferences, circular habits and circular buildings
in retail and among consumers, and reduce waste in the production and supply chain, including postharvest waste
OUR CONTRIBUTION
Through the work on equality, inclusion and diversity and human rights and transparency, the Olav Thon Group will contribute to SDG 10 – less inequality. A working group for equality, inclusion and diversity will be established to draw up a strategy for this work. It will aim to address the inclusion and equality of everyone regardless of gender, age, race, disability, national origin, religion, ethnicity or economic or other status.

Action: Increase the proportion of locally produced food and drink, increase the proportion of reused materials, increase the sorting rate, reduce food waste
UN sub-goals:
• 12.2 By 2030 achieve sustainable management and efficient use of natural resources
• 12.5 By 2030, significantly reduce waste through prevention, reduction, material recovery and reuse
• 12.3 By 2030, halve global food waste per capita, both
• 12.8 By 2030 ensure that all people throughout the world have relevant information and understanding of sustainable development and a way of life in harmony with nature
• 12.b Develop and implement methods to measure the impact of sustainable tourism that creates jobs and promotes local culture and products
Pillar: Social justice
Key topic: Inclusive workplace and human rights and transparency
Action: Establish a working group and create a strategy for equality, inclusion and diversity, achieve 40% women in total and in management level 1-3, as well as on the board of the Olav Thon Group.
UN sub-goals:
• 10.2 Before 2030, ensure empowerment and promote the social, economic and political inclusion of all, regardless of age, gender, disability, race, ethnicity, national origin, religion or economic or other status.
OUR CONTRIBUTION
By reducing emissions and strengthening the group’s ability to adapt to climate change, the Olav Thon Group will contribute to SDG 13 – stop climate change. Reducing emissions will help reduce global warming and climate change. The Olav Thon Group believes that this is essential in order to contribute to this sustainability goal. With the assumption that some climate change will occur regardless of whether we manage to achieve the goals for reducing emissions, the group must map climate-related risks in order to prepare and adapt the business.
OUR CONTRIBUTION
By strengthening sustainability in all of our stages in the development and renovation of properties, the Olav Thon Group will contribute to SDG 11 – sustainable cities and local communities. As a major real estate player, we have a major impact on both cities and local communities. The impact can be both positive and negative based on the considerations we take at the construction site or the operating area. The Olav Thon Group wants to create an inclusive and sustainable urban space. We will therefore contribute by, among other things, reducing emissions from our construction sites and developing green areas, roofs and walls on all buildings.
Pillar: Climate and environment
Key topic: Transition to a low-emission society
Action: Reduce emissions in scope 1 and 2, emission-free construction sites, develop green areas for roofs and walls, conduct an impact analysis, renovations in accordance with the EU taxonomy criteria for climate
UN sub-goals:
• 11.3 By 2030, we will contribute to strengthening inclusive and sustainable urbanisation and the opportunity for participatory, integrated and sustainable community planning and management in the countries in which we operate.
• 11.4 We will contribute to strengthening efforts to protect and secure the world’s cultural and natural heritage
• 11.6 We will contribute to reducing the negative impact of cities and local communities on the environment (measured per capita), with particular emphasis on air quality and waste management.
• 11.7 We will contribute to ensuring that everyone has access to safe, inclusive and accessible green areas and public spaces.
Pillar: Climate and environment
Key topic: Transition to a low-emission society and climate impact
Action: Map and report on climate risk for own activities and for the most important suppliers, reduce emissions in scopes 1 and 2 by 60%
UN sub-goals:
• 13.1 Strengthen the ability to withstand and adapt to climate-related hazards and natural disasters in all countries
• 13.3 Strengthen the ability of individuals and institutions to counteract, adapt and reduce the consequences of climate change and their ability to provide early warnings, as well as strengthen knowledge and awareness of this.

OUR CONTRIBUTION
By taking nature and biodiversity into account in the development and renovation of our properties, the Olav Thon Group will contribute to SDG 15 – life on land. The construction of properties leads to the depletion of nature and has a negative effect on biodiversity and ecosystems. Although our properties are largely located in already developed areas, we have the opportunity to build up some of the nature that was once destroyed. The Olav Thon Group wants to contribute by establishing green areas, roofs and walls, as well as pocket forests on both new and existing properties. In addition, we will conduct nature impact analysis on all development projects to get a clearer picture of our impact on nature.
22 23
Pillar: Climate and environment
Key topic: Customer preferences and conservation of natural resources and biodiversity
Action: Conduct an impact analysis of all development projects, green areas/pocket forests for all new buildings and develop green areas, roofs and walls on 60% of existing properties
UN sub-goals:
• 15.1 By 2030, the sustainable use of freshwater ecosystems and services utilising these ecosystems, on land and inland areas, in particular forests, wetlands, mountains and drylands, will be preserved and restored, in accordance with the commitments of international agreements
• 15.5 Take immediate and comprehensive action to reduce the destruction of habitats, stop loss of biodiversity and protect endangered species by 2030 and prevent their extinction
Our sustainability work
Since 2013, the Olav Thon Group has worked systematically with sustainability and social responsibility. In 2022, we launched our first sustainability strategy to make our work more concrete and targeted.
In order to integrate considerations of climate and the environment, circular economy, human rights, equality and other social conditions, as well as combating corruption, the Olav Thon Group launched our first-ever sustainability strategy in 2022. In addition, the group has drawn up several policies and guidelines, signed up to the UN Global Compact, prepared an annual report in accordance with GRI Standards, and has its own sustainability team that holds monthly status meetings with group management.
Organisation of the work
The Olav Thon Group’s overall goal is to have a common system for the group’s sustainability work. The new sustainability strategy helps us to systematise and operationalise our sustainability work.
In light of the new strategy, an internal sustainability handbook was prepared. To ensure the correct, relevant and good flow of information, the system is communicated through the Olav Thon Group’s Sustainability Handbook. The sustainability strategy increases the integration between the sustainability work and Olav Thon Group’s business areas. The importance of sustainability is becoming more prominent at every stage of the business. The various specialist departments and operating units will have a clearer role in sustainability work and will be more accountable.
The formal responsibility lies with the board and group management. The Olav Thon Group’s board is responsible for the sustainability strategy and decisions related to it. Group management has overall responsibility for the work and achievement of goals, and each executive vice president has the main responsibility for sustainability work within his/her respective business areas. Through monthly status meetings with the Sustainability Team,
group management is kept up to date on the status of the sustainability strategy and sustainability work in particular. This is to ensure measures are handled effectively and that group management is kept up to date on the topic.
Professional responsibility and daily responsibility for reporting, strategy development, facilitation and coordination have been assigned to the HSE department by the group's sustainability team. The sustainability team consists of a sustainability consultant, who has technical responsibility for sustainability and a sustainability consultant, who has main responsibility for reporting. The sustainability team is also responsible for the overall measurement and reporting of strategic objectives.
In the sustainability handbook, responsibility for day-today follow-up and achievement of goals is delegated to the relevant departments. It is defined which departments have professional responsibility for relevant specialist areas. It is also defined which departments are responsible for operations, budgets, technical conditions, commercial responsibility, purchasing, green financing, as well as diversity and inclusion. The sustainability handbook and action plan for the Olav Thon Group clarify the
24
25
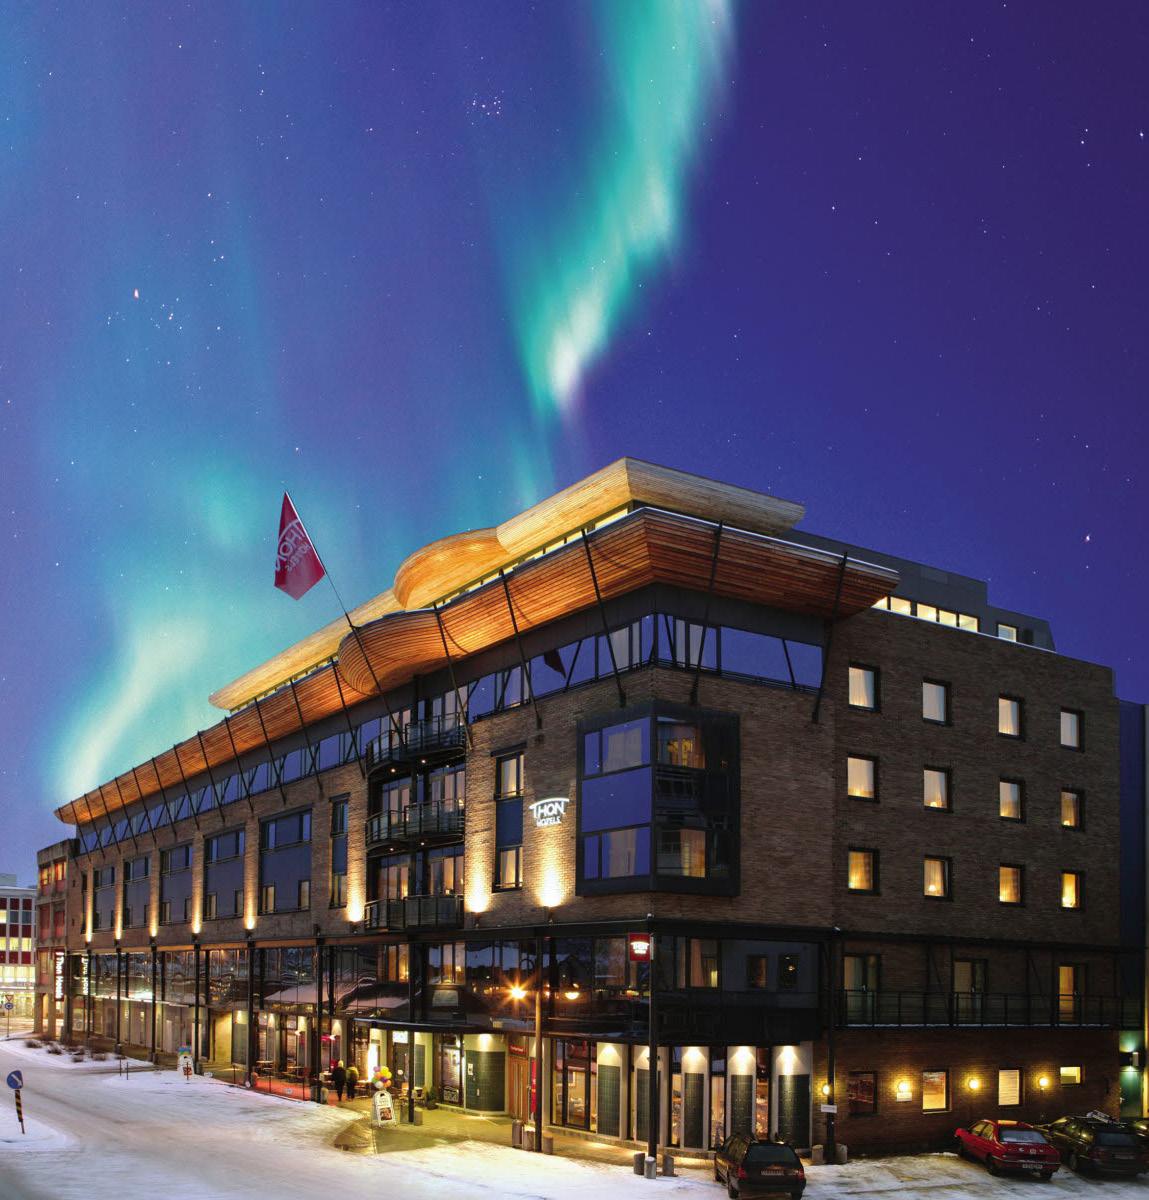
Thon Hotel Lofoten
responsibility of the various departments in ensuring the group achieves its goals by 2030.
The work with social responsibility and sustainability must be made visible internally and externally through the annual sustainability report as well as internally through the use of own tools for internal communication.
Policies and guidelines
The Olav Thon Group has several policies and guidelines to facilitate good and structured sustainability work.
SUSTAINABILITY POLICY
The group has previously had a corporate social responsibility policy that described the group’s goal to strive for the most sustainable development possible in its business operations. The group’s corporate social responsibility and sustainability work are based on Norwegian legal requirements and standards, as well as the principles of the UN Global Compact and the guidelines of the Global Reporting Initiative (GRI).
In 2022, a new policy was developed in accordance with the Olav Thon Group’s sustainability strategy; policy for sustainability. The policy sets out the fundamental guidelines in the group's sustainability work and provides guidance to all managers and employees on how the Olav Thon Group should work with sustainability. It is based on Norwegian law, guiding principles, international frameworks, and the group’s sustainability strategy.
SUSTAINABILITY ACTION PLAN
In connection with the new sustainability strategy, an overall action plan for sustainability work in 2023 was prepared across the group’s various units. The action plan includes the goals and measures set for 2023 in the
strategy, as well as other sustainability-related activities to be carried out throughout the year.
The group management approves and adopts the action plan, while the Sustainability Team manages the action plan. Each department that has been given responsibility for the measures/activities in the action plan must ensure that time and capacity are allocated to implement the individual measures/activities. Measures/activities in the action plan follow the group’s sustainability strategy and associated roadmap.
CODE OF ETHICS
The Olav Thon Group’s code of ethics must ensure that our employees take our shared values with them in all parts of our work. They underpin the group’s vision, purpose and shared values. The document must provide a framework for what is perceived as responsible behaviour. This is important to our employees, guests and customers, partners, suppliers, business partners, and to society as a whole. An code of ethics contributes to mutual respect and trust, which are important for operating business practices today as well as in the future. Find out more about our code of ethics on the Olav Thon Group’s website
ETHICAL REQUIREMENTS FOR SUPPLIERS
The Olav Thon Group sets requirements for our suppliers to safeguard our sustainability work at all stages of our supply chain. To clarify what we expect from our suppliers, we have drawn up a set of requirements based on the UN conventions and ILO core conventions. The requirements cover topics such as human rights, forced labour, child labour, freedom of association, wages, discrimination, HSE, the environment, corruption and animal welfare.
The ethical requirements oblige our suppliers to comply with these, and it is expected that these, or requirements at least as extensive, will be passed on to their subcontractors. We also expect them to contribute to the subcontractors’ compliance with the requirements, as well as working to comply with the requirements on their own behalf.
Reporting practices
This is the Olav Thon Group’s ninth sustainability report. The purpose of the report is to describe how the group strives to work responsibly and more sustainably.
Since 2013, the Olav Thon Group has been reporting in accordance with the Global Reporting Initiatives (GRI) reporting framework. This report complies with GRI Standards.
DEFINITION AND REPORTING PERIOD
This sustainability report is aimed at our customers, guests, tenants, employees, investors, suppliers, the communities in which we operate, interest groups and public authorities. We regard all of you who are influenced by and have a great influence on our business as stakeholders.
OTHER POLICIES AND GUIDELINES
The Olav Thon Group has several policies and guidelines within social responsibility and sustainability.
Policies:
• Environmental policy
• Policy for diversity and gender equality work
• Group policy for procurement
• Travel policy
Guidelines:
• Guidelines for source sorting
• Guidelines for company car/service vehicle
• Procedure for responsible procurement
• Guidelines for construction projects
Like the annual report, the data discussed in this report is for all companies in the Olav Thon Group, meaning units where the ownership is more than 50%. Exceptions are stated in the explanation associated with the individual data.
The report deals with the calendar year 2022 and has been prepared in Norwegian, Swedish and English. The group has an overall annual reporting cycle for both financial and non-financial reporting from 01.01 to 31.12, and the next report will be published in Q1 2024. The previous report was published in June 2022.
Memberships and certifications
ECO-LIGHTHOUSE (MILJØFYRTÅRN)
Thon Hotels certify all their own hotels in Norway with Eco-Lighthouse (Miljøfyrtårn). As one of Norway's largest hotel chains, Thon Hotels has a responsibility to contribute to a better environment. With over 1.8 million guest nights in a year, it is important to facilitate environmentally friendly consumption, reduced waste volumes and saved energy.
Thon Hotels is environmentally certified in accordance with the head office model. The model ensures anchoring of the environmental management system where the responsibility naturally belongs and clarifies which processes and environmental requirements are met by the head office and which environmental requirements remain for local follow-up in the individual underlying unit.
Eco-Lighthouse has developed the head office model and it consists of a full-fledged digital solution for certification and recertification. In the previous recertification of the head office, Thon Hotels has reviewed the criteria again and distributed these between the head office and the underlying units, without any special changes in the distribution from before. The digital solution makes the
26
27
Formal responsibility Professional responsibility Technical responsibility Budget responsibility Commercial responsibility Purchasing responsibility Responsibility for green financing Responsibility for diversity and inclusion Opera�onal liability
certification process simpler and more transparent for the underlying units and it enables better integration with the Eco-Lighthouse Manager at the head office. Certification with the new model was carried out for the first time in 2017 with great success. Thon Hotels was certified in 2022 - The certification is perceived to have a good effect on the hotels' environmental work.
The head office model will contribute to simpler and more rational certification for the hotels, stronger
GREEN DOT
central anchoring and better information flow. Thon Hotels' overall environmental results are presented to management annually. The goals of the environmental work will be further strengthened and made visible. It is expected that the pressure will be kept up on certification and that all hotels are Eco-Lighthouse certified, both selfowned and partner hotels.
Thon Hotels is a control member of Green Dot Norway and sets requirements for its Norwegian goods suppliers for membership in the return scheme for packaging.
GREEN BUILDING ALLIANCE
In 2019, the Olav Thon Group became a member of the Green Building Alliance. The Green Building Alliance is a non-profit member association for companies from the construction and real estate sector. The Olav Thon Group sees the Green Building Alliance as an important arena for exchanging expertise with the industry, so that the Olav Thon Group can become part of a sustainable construction and real estate sector. This is a good way to announce our social responsibility and an important source of green real estate development.
In the Olav Thon Group, we focus on developing the skills among technical operating personnel. Membership in the Green Building Alliance has given us access to valuable training materials. The actual skills development has taken place individually with the help of online training with
central follow-up. In this way, the individual operator has been able to control the pace and progress. Membership in the Green Building Alliance is perceived to make a positive contribution to this increase in skills as well as collaboration across the real estate industry.
ETISK HANDEL NORGE (ETHICAL TRADING INITIATIVE)
In 2022, the Olav Thon Group became a member of Etisk Handel Norge (Ethical Trading Initiative). Etisk Handel Norge is a member organisation and resource centre for sustainable trade. They purpose is to promote responsible business practices in supply chains so that trade contributes to safeguarding human and workers rights, society, animals and the environment.

Through the Olav Thon Group’s membership of Etisk Handel Norge (Ethical Trading Initiative), we are committed to working for sustainable business practices that respect people, society and the environment.
We receive guidance and resources in the work with responsible business practices. We believe that the membership helps us in our work with due diligence assessments and responsible business practices.
28
Thon Hotel Harstad
Transition to a low-emission society
Building and renovating properties has a major impact on the climate. Here there is a big opportunity for the Olav Thon Group. With the focus on the transition to a low-emission society, we can reduce our negative impact, and increase our positive impact, on emission-related climate change.
The construction industry generally accounts for approximately 40% of the world’s greenhouse gas emissions. The Olav Thon Group contributes to greenhouse gas emissions at all stages of our value chain. Transitioning to a low-emission society has become a key topic of our sustainability work to minimise our negative impact on the climate.
The Olav Thon Group has greenhouse gas emissions linked to all links in the value chain. From upstream, emissions
TRANSITION TO A LOW-EMISSION SOCIETY
CLIMATE AND NATURE
are linked to raw materials and the production of goods. In our own activities, emissions come from the development, renovation and operation of properties, as well as a large proportion coming from the group’s energy consumption. From downstream, emissions are largely related to the tenant’s and end-user’s energy consumption. The emissions from the value chain can help to cause local pollution and global warming, which in turn can lead to climate-related health issues or a lack of raw materials due to climate change.
2023 2025 2027 2030
Reduce emissions in scope 1 and 2 by 45%
Reduce emissions in scope 1 and 2 by 60%
construc�on sites in Oslo
45% of renova�ons in accordance with the taxonomy
50% of construc�on sites in Norway must be emission-free
60% of renova�ons in accordance with the taxonomy
All construc�on sites in Norway must be emission-free
100% of renova�ons in accordance with the taxonomy
EV charging at all shopping centres
All new buildings must have an energy label A
Map renewable produc�on on proper�es
Purchase guarantees of origin for electricity consump�on
All new builds must be BREEAM NOR Very Good, or equivalent
15% of shopping centres and hotels must be at least BREEAM
In-use Very Good
10% of exis�ng buildings must be BREEAM In-use cer�fied
All new builds in accordance with the EU taxonomy criteria for climate
30% of shopping centres and hotels must be at least BREEAM
In-use Very Good
25% of exis�ng buildings must be BREEAM In-use cer�fied
60% of shopping centres and hotels must be at least BREEAM In-use Very Good
50% of exis�ng buildings must be BREEAM In-use cer�fied
Net zero in 2050 Se�ng STB11 for own emissions and defining a baseline 30% of renova�on according to the EU taxonomy for climate Emission-free
31
We therefore want to reduce our greenhouse gas emissions in order to minimise the negative impact it can have on people and nature. In addition, we are experiencing an increase in climate-related legislation that has been passed in recent years. It is important for the Olav Thon Group to comply with these laws in a good and appropriate way, and increased efforts to reduce climate emissions are an important means of doing so. In this context, we have set goals and sub-goals for the next few years to reduce our greenhouse gas emissions by 2030.
This will help us well on our way towards the group’s longterm ambition of becoming net zero by 2050.
Since 2020, the Olav Thon Group has prepared an annual carbon accounting report. This has been the basis for the work to reduce emissions. Energy and waste that have been key topics since our first materiality analysis in 2016 remain important topics for the group as this is where our biggest emissions come from (find out more about energy page 34 and waste page 46).
Carbon accounting report 2022
The Olav Thon Group's carbon accounting report has been prepared in accordance with the GHG protocol and satisfy the requirements of GRI's standard for carbon reporting1.* The emission factors used are taken from the IPCC (AR4). The carbon accounting report has been prepared for the calendar year 2022.
We have identified the most significant emissions in scope 1, 2 and 3. The emissions are calculated for all underlying business areas in the Olav Thon Group. Read about the data in the appendix on page 70.
We have now defined a base year to be used as a measuring point when measuring future emissions. The base year was set to 2019. The reason we choose 2019 as our base year, rather than 2020, from which we have already calculated emissions, is that 2020 is not considered a good basis for comparison. There are two reasons for this:
1. 2020 was characterised by the pandemic and lockdown, and therefore abnormal operations that do not reflect a normal year for our business;
2. the carbon accounting report that was prepared for 2020 is not considered to be sufficient, since errors and omissions have been found in the data.
When we collected data for the 2019 carbon accounting, we wanted the data of the same quality as the 2022 carbon accounting. Light heating oil is included in the 2019 carbon accounting, even though we have not included this in the accounting for 2020 and 2021.
Performance for 2022 is therefore compared with both the previous year 2021, and the base year 2019, to see annual progress, as well as how we are doing in relation to the emission goals in the sustainability strategy.
EMISSIONS PER SCOPE
a minimal increase of 1% (338 tCO2e). Emissions linked to stationary incineration were 3,261 tCO2e in 2022. This was a decrease of 4% compared to the previous year. The decrease is due to reduced emissions related to propane gas consumption.
SCOPE 2
Scope 2 is the group’s emissions linked to electricity, district heating and district cooling. In 2022, scope 2 accounted for 36% of the group’s total emissions. This corresponds to 10,732 tCO2e. This is a decrease of 4% compared to 2021, which corresponds to 427 tCO2e. The decrease is due to a decrease in emissions related to electricity of 18%. This is equivalent to 1,710 tCO2e. This is probably connected to reduced consumption of electricity, as well as a lower conversion factor. In 2021, the conversion factor to electricity was 0.0332 tCO2e/ MWh. In 2022, it was reduced by 10% and was therefore 0.0299 tCO2e/MWh. A lower conversion factor is due to a higher proportion of renewable energy in the energy market. Electricity is equivalent to 75% of emissions in scope 2 and reduced electricity consumption is therefore essential in order to achieve our 2030 goals.
The decrease in emissions linked to electricity is offset by increased emissions linked to the consumption of district heating and district cooling. In 2021, consumption of district cooling was so low that there were no emissions associated with consumption. In 2022, consumption has increased, and emissions related to district cooling are 97 tCO2e. In addition, emissions linked to district heating have increased by 91%, i.e. 1,246 tCO2e. Emissions from consumption of district heating include 24% of emissions in scope 2. By comparison, district heating consumption
SCOPE 1
2021 TO 2022 DEVELOPMENT
We are constantly working on improving the data in our carbon accounting, and an increase in reported emissions due to general improvements in the data may therefore occur. We mapped local district heating emission factors for several of our properties with district heating consumption. Previously, we have used an emission factor based on a Norwegian mix, but our supplier of the carbon accounting has some emission factors related to specific areas. By using these on the properties that belong to the same concession area as the emission factors, we achieve more accurate carbon accounting. For the properties that were not located in a concession area that also had an associated emission factor, we used the Norwegian mix. Swedish mix was used for our properties in Sweden with district heating consumption. In addition, we have included light heating oil in our carbon accounting for
2022. Both
have used heating oil for production. This is something we have not had data on before.
The Olav Thon Group’s total reported emissions for 2022 were 30,066 tCO2e. This is an increase of 34% compared to the previous year. This is equivalent to 7,571 tCO2e. The main reason for this increase is related to the fact that this year we have included light heating oil in our carbon accounting. In 2022, emissions related to light heating oil amounted to 6,942 tCO2e. This corresponds to 23% of the group’s total emissions in 2022, and is 92% of the total increase in the group’s emissions. If we exclude heating oil from the carbon accounting for 2022, the group’s total emissions were 23,125 tCO2e. This was an increase of 3% compared with the previous year.
Scope 1 has previously been the smallest emissions category in our carbon accounting. In 2022, it became the second largest. It consists of emissions related to transport – consumption of diesel and petrol, as well as light heating oil. It also consists of stationary combustion – consumption of gas (propane, LPG and natural gas), as well as pellets. In 2021, scope 1 accounted for 16.5% of total emissions. In 2022, the share was 35% of the group’s total emissions in 2022. This is equivalent to 10,541 tCO2e, compared to 3,725 tCO2e in 2021. The main reason for this is that we have now included the consumption of heating oil. Scope 1 has therefore increased by 183% from 2021 to 2022.
Emissions related to heating oil represent 66% of the total emissions from scope 1. Excluding heating oil, 3,599 tCO2e remains in scope 1 related to petrol, diesel, gas and pellets. Among these categories, there has been a decrease of 4% compared to 2021. We can therefore assume that the increase in emissions, compared with the previous year, is due exclusively to heating oil. The other emissions linked to transport (petrol and diesel) have had
Reduc�on in emissions per scope Previous year 2021 Status 2022 Scope 1 Emissions in tCO2e Total 22,496 30,066 Base year 2019 31,493 Transport Stationary combustion Power District heating District cooling Waste Business travel (flights) Scope 2 Scope 3 8,466 4,148 4,318 14,695 1,618 331 5,880 503 16,644 6,383 3,725 335 3,389 9,732 1,3667,541 133 11,159 7,673 10,541 7,280 3,261 8,022 2,612 97 8,407 388 10,732 8,794 Change from previous year 7,571 (34%) 6,817 (183%) 6,945 (2,072%) -128 (-4%) -1,710 (-18%) 1,246 (91%) 97 (-) 866 (11%) 255 (192%) -427 (-4%) 1,120 (15%) Change from base year -1,426 (-5%) 2,075 (25%) 3,131 (75%) -1,056 (-24%) -6,673 (-45%) 994 (61%) -234 (-71%) -115 (-23%) 2,526 (43%) -5,912 (-36%) 2,411 (38%)
Unger Fabrikker and Follo Fjernvarme
1 See GRI Index for complete reporting according to GRI Standards. tCO2e
10,000 2,000 0 4,000 6,000 8,000 3,724.5 11,158.7 7,673.4 Scope 1 Scope 2 Scope 3 12,000 Sta�onary combus�on Transport Power District cooling Waste Percent EMISSIONS PER CATEGORY Business trips District hea�ng 9% 11% 28% 1% 24% 27% 0%
32 33
has only increased by 11%. Hence, the increase is largely due to a higher conversion factor. The conversion factor in 2022 has increased by 73% compared to 2021. It went from 0.0139 tCO2e/MWh to 0.0239 tCO2e/MWh. This shows that the Olav Thon Group is to a certain extent dependent on the energy market becoming more renewable in order for us to be able to achieve our goals by 2030. Read more about how we work with energy and our energy consumption in 2022 on pages 34 and 35
SCOPE 3
Scope 3 emissions are linked to our emissions from upstream and downstream processes. As of now, this entails emissions from waste and business travel (flights). In 2022, scope 3 accounted for 29% of the group’s total emissions. This corresponds to 8,794 tCO2e. In comparison with the previous year, this is an increase of 15%, i.e. 1,121 tCO2e. This is mainly due to an increased volume of waste, as the amount of waste has also increased by 15%. Read more about our waste management and circular habits on pages 46 and 47. In addition, there has been an increase in emissions linked to air travel of 192%. It is assumed that this is linked to a more normalised society, and thereby the possibility of more business travel.
PROGRESS IN RELATION TO GOAL ACHIEVEMENT
It follows from the Olav Thon Group’s sustainability strategy that by the end of 2027, the total reported emissions to the group in scopes 1 and 2 must be reduced by 45%, and further by 60% by the end of 2030. This must be measured from the 2019 base year. In 2022, we had reduced the overall emissions in scopes 1 and 2 by 3,837 tCO2e compared to emissions from 2019. That is a decrease of 15%. This is considered as a very positive development that helps us well on our way to achieving our goals.
Compared to the 2021 carbon accounting report, we saw that emissions related to heating oil consumption account for a large proportion of scope 1 emissions. It is therefore interesting to see how we would have fared if we had managed to phase out the use of heating oil. Without heating oil, total emissions from scopes 1 and 2 in 2022 would have been 14,331 tCO2e. The reduction
Energy
in emissions compared with 2019 would have been 33%. This gives a clear picture of how much heating oil consumption can affect our carbon accounting. If we manage to replace heating oil with renewable fuel, we can probably reduce our emissions significantly. This will therefore be an important development point in order to achieve the goals we have set in our sustainability strategy up to 2030.
In addition, the group is still growing with more properties. More properties mean more square metres that result in emissions. It is therefore also essential to look at the emission intensity (kgCO2e/m2 ). In 2022, the emission intensity for scopes 1 and 2 was 6.46 kgCO2e/ m2. This is a 20% decrease compared to 2019, when it was 5.19 kgCO2e/m2 .
FUTURE OUTLOOK
In 2023, the Olav Thon Group is expected to continue to work on improving the data for our carbon accounting. Among other things, we aim to set Science Based Targets (SBTs) during 2023. This will require us to map scope 3 to a much greater extent than we have done so far.
Furthermore, the Olav Thon Group must reduce emissions in scopes 1 and 2 by 45% by 2027 and 60% by 2030. This means the total emissions for scope 1 and 2 combined, compared with emissions from the 2019 base year. The targets were set based on Norway’s and the EU’s targets for climate emissions reduction up to 2030, and on the basis that the Olav Thon Group wants to be a committed player in this area. As figures from the carbon accounting report for 2022 show, we are already well on the way to reducing emissions.
Our targets for BREEAM certification and buildings according to the taxonomy will also help us cut emissions. Both set requirements for energy consumption in buildings that will have an impact on emissions in scope 2. Here, the target is for 30% of renovations to be in accordance with the taxonomy’s criteria for climate in 2023. The challenge with taxonomy has largely been linked to good quality data. This is development work that will continue throughout 2023.
Energy has been a main focus area of the Olav Thon Group’s sustainability work for several years. The focus has been on energy management and reduction of energy consumption through better systems and more frequent reporting. A transition to a low-emission society will require a focus on energy efficiency in buildings. To reach net zero by 2050, it is assumed that almost all existing buildings will have to undergo an energy-efficient renovation.
There is a transition risk linked to the gradual phasing in of renewable energy, energy efficiency improvement and alternative energy sources. Such investments can result in unpredictable energy costs. Increased costs are expected early in the process, which will be reduced in the long term. According to the International Energy Agency, electrification and energy efficiency will contribute to the reduction of emissions in the construction sector by up to 70%, but energy-efficient buildings are required. Energy will therefore continue to be an important focus area in the group’s sustainability work.
THE GROUP'S WORK WITH ENERGY
The Olav Thon Group works systematically with energy to reduce negative impact on the climate and the environment. Our sustainability strategy focuses on energy reduction and increased consumption of renewable energy. In addition to this, our environmental policy focuses on energy management through awareness raising, training and increased competence. The work is followed up by our own energy department, which has the overall professional responsibility for work with energy management and energy optimisation in the Olav Thon Group. Implementation and daily follow-up are carried out by the individual operator at the property.
Four focus areas have been defined within the energy work to help the group achieve its emission reduction targets. These four areas are energy management, maintenance, energy-saving measures and renewable energy.
ENERGY MANAGEMENT
There is now an increased focus on energy management in the group, with the focus on systematic and targeted energy work for energy optimisation. The interaction between the group’s energy monitoring system, technical operations personnel and the total technical service agreement is fundamental to the energy management work.
MAINTENANCE AND UPGRADES
In order to achieve the desired targets for reduced emissions in scopes 1 and 2, there is a need for energyefficient technical facilities in our properties. This has led to a number of maintenance and upgrade projects in the group that are essential for energy optimisation. In these projects, digitisation and facilitation of future smart solutions are a priority.
RENEWABLE ENERGY
The target of reduced emissions in scopes 1 and 2 also depends on the type of energy used in our properties. The group therefore wishes to increase its focus on renewable energy. The aim is to map opportunities for renewable energy in our properties.
ENERGY-SAVING MEASURES AND ENERGY LABELLING
Beyond operational optimisation, maintenance and upgrade projects, as well as renewable energy, energysaving measures are necessary. The Olav Thon Group is working on standardising energy-saving measures such as quantity regulation, variable air quantities, lighting control, and developing smart control systems such as forecast management of snow melting and ventilation.
During 2023, the group will start a procurement process to energy label its property portfolio again due to the limited duration of energy labelling. This will be done as part of the other energy work and requires a survey of the properties to identify where we will be carrying out which measures.
Energy consump�on Non-renewable fuel Renewable fuel Power District hea�ng District cooling Electricity sales District hea�ng sales District cooling sales Steam sales 16,970 18,118 293,060 98,562 29946,001 9,217MWh Total energy consump�on* 371,791 469,410 40,797 30,441 268,232 109,125 15,34635,000 8,900420,041 Percentage 9% 7% 58% 24% 3% 100% 23,826 (140%) 12,323 (68%) -24,828 (-8%) 10,563 (11%) 15,048 (5,036%)-11,001 (-24%) -317 (-3%)48,250 (13%) 36,435 15,337 337,789 82,342 17,80410,852 9,445*According
GRI Standards
energy
(total energy consump�on –
sales). 4,362 (12%) 15,104 (98%) -69,557 (-21%) 26,783 (33%) -2,458 (-14%)24,148 (233%) -545 (-6%)-49,369 (-11%) Previous year 2021 Status 2022 Base year 2019 Change from previous year Change from base year Renewable fuel Non-renewable fuel Power District hea�ng District cooling Percent ENERGY CONSUMPTION PER CATEGORY Steam 58% 7% 24% 3% 9% 0% 34 35
to
defini�on of total
consump�on
energy
ENERGY CONSUMPTION
The figures are taken from our energy portal Energinet. This contains properties and meters associated with the individual property. Data from the hotels in Brussels and Rotterdam, as well as the companies Unger Fabrikker and Follo Fjernvarme are collected manually. In line with the carbon accounting data, we are constantly working on improvements to the data for energy consumption. An increase in reported consumption due to improvements in the data may therefore occur. For more information on the data, see the appendix (p. 69). Categories for reporting follow from GRI Standards. An overview is included in the GRI index (p. 67).
The Olav Thon Group’s total reported energy consumption in 2022 was 420,041 MWh. This is an increase of 13% (48,250 MWh) compared to 2021. The increase is mainly due to the inclusion of heating oil. 25,610 MWh of heating oil was used in 2022, which corresponds to 69% of the total increase in reported energy consumption. This is due to the lack of heating oil consumption data in 2021.
In addition, the size of the property portfolio changes from year to year. This affects the consumption of energy. It is therefore interesting to look at the energy intensity (kWh/ m2). In 2022, the energy intensity was 122.3 kWh/m2. This is an increase of 10% compared to 2021 (111.3 kWh/m2). This is probably due to the fact that several of our properties were affected by lockdowns in 2021. As a result, several properties required much lower energy consumption than in 2022 when everyone returned to normal operation. This is also related to the consumption of heating oil, which is not included in the energy base for 2021.
Heating oil belongs to the category of non-renewable fuel together with diesel, petrol and gas. The category accounts for 9% of the reported energy consumption in the group. In 2022, this consumption was 40,797 MWh. This is an increase of 140% compared to the previous year. As mentioned, we have now included light heating oil for production in the data. In 2022, heating oil consumption was 25,610 MWh. This corresponds to 63% of nonrenewable fuel consumption. If we exclude consumption of heating oil for a more realistic comparison, other reported consumption of non-renewable fuel has been reduced by 9%. This is due to a significant reduction in petrol and diesel consumption.
Reported consumption of renewable fuels has also increased by 70% (12,726 MWh). Renewable fuel consists of pellets used in the production of district heating.
Reported energy consumption was 268,232 MWh in 2022, and has been reduced by 8% compared with 2021. This corresponds to 24,828 MWh. This is probably the result of both the group’s work on energy optimisation and a consequence of high electricity prices in 2022. The decrease is offset by increased reported consumption of district heating and district cooling, which has increased by a total of 25,208 MWh. Part of the explanation could probably be that in some cases it has been chosen to use district heating and district cooling rather than electricity for economic reasons, since electricity prices increased sharply in 2022. In addition, the emission factor related to district heating in 2021 was lower than the emission factor for
Climate impact
electricity. Hence, district heating was considered a cleaner energy source. Unfortunately, this has changed in this year’s carbon accounting report, as it appears that the emission factor for district heating has increased, while the emission factor for electricity has decreased.
District heating and district cooling sales were also somewhat lower in 2022 than in 2021. In 2022, we sold 35,000 MWh district heating and 8,900 MWh district cooling.
PROGRESS IN RELATION TO THE 2019 BASE YEAR
2019 is now set as a base year and will be the basis for comparison in the future when we measure progress towards 2030. Energy is also an important contributor to achieving the goal of reduced emissions by 2030. It is therefore relevant to look at energy consumption in 2022 compared to energy consumption in 2019. 2019 is also a year with more normal operations than 2021 and 2020, as 2019 was before the pandemic that has affected the business in recent years.
Compared to 2019, the group has reduced total reported energy consumption by 11%. This is partly due to reduced power consumption (-21%) and district cooling (-14%). In addition, district heating sales have increased by 223% since 2019. With an increasing property portfolio from 2019, this are regarded as very good figures. Despite more square metres requiring energy, energy consumption has still been reduced. In 2019, the energy intensity was 144.4 kWh/m2 This corresponds to a decrease of 15%.
Consumption of renewable fuels has increased significantly by 98% since 2019. This is considered very positive as we want higher consumption of renewable fuel and lower consumption of non-renewable fuel. Nevertheless, nonrenewable fuel has increased by 12%. This is explained by the increased consumption of heating oil. Due to high electricity prices, one of our companies had to rely on heating oil rather than electricity for economic reasons.
FUTURE OUTLOOK
It is expected that the good work will continue and that we are constantly increasing internal competence and awareness of energy optimisation. We are also expected to continue investigating new opportunities for optimisation and that we are increasingly looking at the opportunities available to increase the proportion of renewable energy.
The Olav Thon Group’s sustainability strategy aims to map opportunities for renewable production in our properties by 2023. This will affect energy consumption in the future. In addition, the goal of being in accordance with the taxonomy’s criteria for climate and BREEAM certification of buildings will lead to energy consumption of the individual properties.
The Olav Thon Group affects the climate via greenhouse gas emissions in the value chain. Equally, these climate changes impact us in return. It is expected that we will experience this to a greater extent in the future, which will expose the group to several different types of risks linked to climate change.
The Olav Thon Group impacts climate risks for the business indirectly through the impact we have on the climate, as well as how we improve on such risks. To know how to deal with climate risks, we need to get an overview of the risks we face. This has not been done yet for either Olav Thon Eiendomsselskap, or the Olav Thon Group.
However, when conducting the double materiality analysis, several risks were identified in the real estate industry related to climate change. There is a general physical risk in the real estate industry linked to extreme weather events that can result in damage to buildings and infrastructure. Among other things, snow melting, landslides and more rain can lead to an increased risk of flooding, which can cause major damage to buildings.
Risks of climate-related damage to buildings can result in the risk of increased costs of upgrading and renovation to reduce exposure and be prepared for potential future climate damage. In addition, this may result in increased costs associated with insurance policies or building insurance.
Climate change can also lead to changed or limited access to goods. Suppliers of raw materials and raw material producers may be affected by climate change such as droughts, floods or water shortages which may change the industry’s access to raw materials. Different types of raw materials may also be at risk of becoming depleted. This can result in reduced access and increased price fluctuations.
As a large company, the Olav Thon Group can actively work to reduce its impact on the climate. This will to some extent reduce the likelihood and extent of climate change exposing the business to risks. In addition, we can adapt our business to better prepare for the risks that may occur. This can make it easier for us to manage the risks when they occur.
Identifying climate risks will help us identify how we can best manage the risks of preventing or reducing the damage they can cause to the group, as well as how we best adapt our business to manage the risks that arise. Therefore, climate impact has become am important topic at the Olav Thon Group.
CLIMATE IMPACT
DISTRICT HEATING AND DISTRICT COOLING SALES District hea�ng District cooling 30,000 20,000 10,000 0 35,000 8,900 MWh 40,000
Net zero in 2050 Map climate risk in own opera�ons Include ques�ons in enquiries to suppliers 2023 2025 2027 2030 Report climate risk in accordance with TCFD framework
36 37
Future outlook
The above-mentioned risks are probably just a few of many climate-related risks. The Olav Thon Group must therefore carry out a project to map climate risks in its own operations. The project will be based on the Task Force on Climate-related Financial Disclosures (TCFD) framework. The purpose of the project is to carry out an overall mapping to identify the risks and opportunities associated with the group’s various business areas. As part of the project, forward-looking climate scenarios will therefore be developed that take into account identified
Customer preferences
risks and opportunities, seek to quantify possible costs related to physical risk and carbon costs, identify riskreducing measures, and develop climate risk reporting.
Objectives have been set for the project to be completed during the first half of 2023. During the second half of the year, we will include questions concerning climate risk in enquiries to both our existing and any new suppliers in order to gain insight into climate risk in the value chain.

Our customers and guests are also becoming more aware of the climate and nature, and are increasingly making demands on what they expect. The Olav Thon Group must therefore adapt to climate-related customer preferences and proactively engage customers and guests.
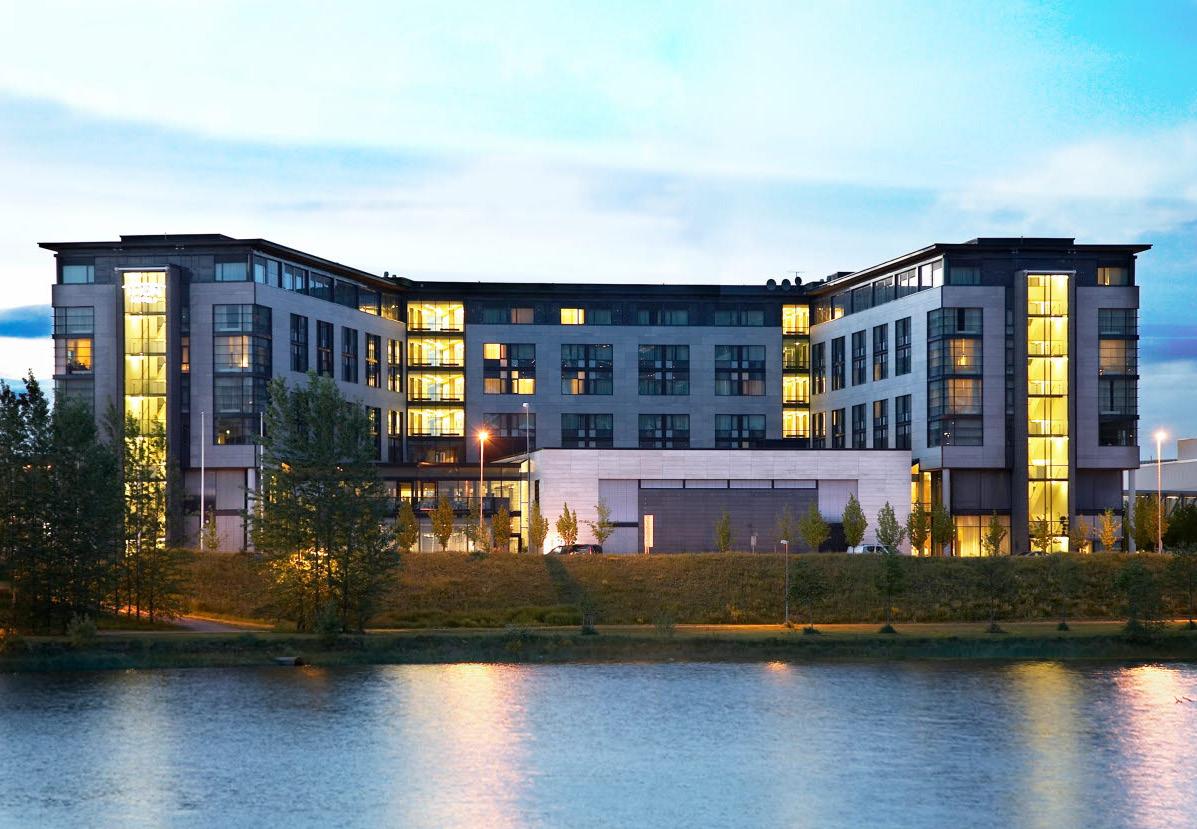
A large part of the Olav Thon Group’s business consists of hotels, a place where people come with expectations of a good experience. The way we run our hotels affects our customers’ and guests’ experience with us. Thon Hotels is genuinely interested in the customer and goes the extra mile to create golden moments and great visitor experiences. In addition, we want to see, hear and understand all guests. Their preferences are therefore essential to meet their needs and expectations and be able to provide them with a good hotel experience.
With an increased awareness of climate change and sustainability, customers’ demand is changing to more sustainable alternatives. We find that hotel guests demand, among other things, more plant-based and sustainable food, and opportunities for more climatefriendly travel.
To safe-guard the latter, all our own Norwegian hotels have been Eco-Lighthouse certified since 2017. Guests have been, and continue to be, an important stakeholder in how Thon Hotels works with sustainability. By EcoLighthouse certification of the hotels, we can show that we are constantly working to minimise emissions related to guest nights.
Lack of understanding of guests’ wishes and needs increases the risk of losing customers. By putting customer preferences in the spotlight, we strive to meet the guests’ climate-related wishes, needs and expectations, which contributes to the good customer experience. This also creates opportunities to attract new customers who are particularly sustainability or climate conscious in their choices. Therefore, customer preferences are considered a key topic in our sustainability work.
CUSTOMER PREFERENCES Nature posi�ve 40% of all food and drink must be locally sourced Vegetarian and vegan op�ons at all hotels and restaurants 70% of all food and drink must be locally sourced 2023 2025 2027 2030 50% of all food and drink must be locally sourced 20% of all food and drink must be locally sourced
38 39
Thon Hotel Arena
Future outlook
Until 2030, the Olav Thon Group will focus on climatefriendly climate preferences in the form of highlighting more sustainable alternatives in our food and drink selection at our hotels and restaurants. Thon Hotels has a goal of "creating, exceeding and meeting travellers’ expectations and preferences". In addition, they have a vision to "lead the way towards the hotel and dining experience of the future". This makes customers’ preferences and food experiences very important for the group’s sustainability work.
As of 2023, all our hotels and restaurants will offer vegetarian options. In addition, all eateries will offer vegan options on request.
In addition, the goal is to increase the proportion of low food miles and locally sourced food and drink at all of our hotels and restaurants. By the end of 2023, 20% of all purchased food and drink must be categorised as low food miles or locally sourced food and drink. In addition, during 2023 we need to find out what will define this categorisation in order to measure progress on the goal towards 2030.
Conservation of natural resources and biodiversity
There is an increased awareness of society regarding the impact on nature associated with the development of property. In addition, the conservation of nature and biodiversity is gaining more attention through international agreements and national legislation. Therefore, the conservation of natural resources and biodiversity has been regarded as an important topic for the Olav Thon Group.
Most of Olav Thon Group’s properties are in already built-up areas. Nevertheless, we can have a significant impact on nature and biodiversity, and vice versa. Regardless of where the property is located, it is what we choose to do with the property that determines whether we have a positive or negative impact on the environment and the surrounding landscape. In already built-up areas, there are great opportunities to increase the positive impact on nature and biodiversity. Nature-positive solutions for properties include green areas or pocket forests and planting on roofs and walls. Such solutions can help protect buildings and property from destroying nature while preserving nature and ecosystems. For example, tree planting can reduce the risk of flooding, stabilise soil and prevent landslides. In addition, this contributes positively to the local community, as trees and plants have a purifying effect on the air, which provides health benefits and well-being for the population, as well as our customers.
We are seeing an increase in the focus on the conservation of natural resources and biodiversity both in politics and in society in general. This may entail a higher risk of increased costs and prices for development due to the expected integration of nature-positive solutions. This can also present challenges in the supply chain with increased prices of materials due to the conservation of forest areas, for example, or with a shortage of goods due to, for example, zero tolerance of timber from rain forests, which will increase the pressure on Norwegian and European forests. In addition, financial institutions and investors are expected to impose greater requirements for reporting and the opportunity to receive green financing.
As a major real estate player, conservation of natural resources and biodiversity is an important topic for the Olav Thon Group. Here there are both risks and opportunities for the business that we consider important to address.
CONSERVATION OF NATURAL RESOURCES AND BIODIVERSITY
Nature posi�ve Conduct an impact analysis on 50% of development projects Set requirements for suppliers rela�ng to impact on biodiversity and nature Green areas/pocket forests for all new buildings Develop green areas, roofs and walls at 10% of exis�ng proper�es 2023 2025 2027 2030 Conduct an impact analysis on all development projects Develop green areas, roofs and walls at 20% of exis�ng proper�es Develop green areas, roofs and walls at 30% of exis�ng proper�es Develop green areas, roofs and walls at 60% of exis�ng proper�es
40 41
2022 status
The focus in the sustainability work of the Olav Thon Group has not been aimed specifically at the conservation of natural resources and biodiversity in the past. However, some sporadic measures have been taken. Among other things, several of our properties now have beehives on the roof. In 2022, the Olav Thon Group entered into a business partnership with ByBi (queen partner).
PARTNERSHIP WITH BYBI
The background to the partnership is an ambition to help highlight the importance of pollinators, urban agriculture and biodiversity in the city. The partnership’s purpose is therefore to increase the knowledge of pollinating insects and biodiversity within the organisation, in line with the Olav Thon Group’s sustainability strategy. ByBi will also be a competence partner for the Olav Thon Group and provide advice and guidance to ensure that correct considerations are taken into account when establishing green areas and developing our properties.
Future outlook
In accordance with the new sustainability strategy of the Olav Thon Group will now focus more on the conservation of natural resources and biodiversity. Among other things, more systematic and continuity in the work is expected, as this is necessary to achieve our long-term ambition to become nature positive.
ByBi offers talks for the Olav Thon Group’s employees, on the smoking and operation of the Olav Thon Group’s own beehives, honey tasting, visits to the beehives with beekeeping and ecology as a theme, honey from the beehives, advice on real estate projects, etc.
ByBi is an environmental organisation and Norway’s largest local association, organised under the Norwegian Beekeeper Association. ByBi offers guidance, advice and courses related to the world of bees, as well as the care of bees and honey production as a service. ByBi focuses on safe urban beekeeping, the use of Norwegian honey and increased awareness of the importance of bees. They actively work to promote green urban development and increased facilitation of biodiversity.
In 2023, green areas or pocket forests will be established at all new buildings. In addition, we will develop green areas, roofs and walls on 10% of all existing buildings. The latter will be continuously worked on, so that we can establish green areas, roofs and walls on 60% of our existing properties by 2030. In addition, we will set requirements for our suppliers related to biodiversity and impact on nature.
42
Jessheim Storsenter
Circular habits
Circular solutions are essential for the Olav Thon Group to reduce the use of natural resources and minimise emissions. We work actively with waste management and working on putting a recovery system in place to minimise this impact.
The Olav Thon Group has an impact on the climate and nature through our circular habits. In short, by circular habits we mean our consumption of goods and handling of waste. High consumption of new goods and products requires a certain degree of use of natural resources, leading to emissions in processing processes and transport stages. When this becomes waste, it has a further impact on the climate and nature, either through emissions from recovery processes or because it ends up as landfill. Circular habits are a key topic of our sustainability work to reduce this negative impact on the climate and nature.
There is an increasing degree of regulatory requirements for circularity and waste management. This is due to a desire to reduce greenhouse gas emissions and minimise the negative impact of high consumption with associated waste on the climate and nature. Among the risks we may face, we expect, among other things, increased prices for the incineration of waste, as well as stricter requirements for waste management.

CIRCULAR SOLUTIONS
A large part of the Olav Thon Group’s activities are related to the operation of properties, in the form of rental of various types of premises – including retail premises at shopping centres and office premises in commercial buildings. Waste from this type of property operation is therefore often linked to our tenants, as well as our customers at the shopping centres. In addition, there is waste associated with the purchase of goods, including packaging. Here there are opportunities for the Olav Thon Group to reduce the negative impact on climate and nature.
Since much of our waste comes from upstream and downstream sources in the value chain, the greatest opportunities lie in facilitating, encouraging and setting requirements for suppliers, tenants and customers. In addition, we must look at our own circular habits and what opportunities the Olav Thon Group has to reuse rather than buy new. This will reduce waste as well as reduce our negative impact on the climate and nature.
CIRCULAR HABITS
70% circular by 2030 Set specific goals and expand the area of use for Thon Gjenbruk Require tenants to commit to a 60% sor�ng rate Expand waste management projects to 15% of shopping centres Require tenants to commit to a 70% sor�ng rate 2023 2025 2027 2030 Require tenants to commit to a 65% sor�ng rate Expand waste management projects to all shopping centres 25% cut in food waste Expand waste management projects to 50% of shopping centres 30% cut in food waste 40% cut in food waste 50% cut in food waste 45
Waste
Waste has been a focus of the Olav Thon Group’s sustainability work for several years. The Olav Thon Group wants to reduce the amount of waste the group produces and be able to point to a high degree of sorting, in order to reduce the group's burden on the external environment.
THE GROUP'S WORK WITH WASTE
The Olav Thon Group has set a goal of achieving a sorting rate of 65%. In this work, guidelines have been drawn up for sorting at source and for waste plans developed for the various units in the business. This has taken place in close dialogue with the provider of waste disposal services. Status meetings are arranged with suppliers on a regular basis. Waste is a recurring topic in our internal communication channels, as well as a topic at status meetings between the Olav Thon Group’s group management and the group’s sustainability team. In light of the new sustainability strategy, this has now developed into an ambition to become 70% circular by 2030. Find out more about the data in the appendix (p. 69)
WASTE VOLUME
The total reported volume of waste in 2022 was 28,272 tonnes. This is an increase of 15.3% compared to 2021. The large increase is probably due to normalisation in society after two years of pandemic. Both 2020 and 2021 were characterised by closed hotels and shopping centres, in addition to home offices. Both years also had lower reported volume of waste. It is assumed that this is linked and that the increased volume of waste in 2022 can therefore be explained by a more normalised state in society. If we compare 2022 with the average volume in the years before the pandemic (2015–2019), which was 29,755 tonnes, the volume of waste has been reduced compared to the previous "normal year".
Like energy and emissions, it is also natural here that a larger property portfolio will increase the amount of waste. That is why we also look at the waste intensity (kg/ m2). In 2022, this was 168.8 kg/m2. This is an increase of
10% compared to 2021 (152.8 kg/m2).
The volume of hazardous waste saw a sharp increase in 2020 due to changes in the classification of waste. In 2022, the volume of waste increased by a further 93 tonnes. This corresponds to an increase of 17% compared to 2021. This is the highest proportion of hazardous waste we have had since we started reporting on waste in 2015. Unger Fabrikker accounts for 86% of the amount of hazardous waste in the Olav Thon Group.
SORTING RATE
The sorting rate describes how much of the waste is sorted from the residual waste. This is a significant goal, since residual waste is mainly sent for energy recovery, and large greenhouse gas emissions are linked to this incineration. The waste that is sorted out is primarily sent for material recovery and is given a new life in new products. This contributes to reduced greenhouse gas
waste. Therefore, the sorting rate of shopping centres will have a major impact on the group’s achievement of its goals. In 2022, the shopping centres had an average sorting rate of 57.4%.
In comparison, the two second largest contributors to the volume of waste are the business area other commercial real estate13, which accounts for 14.2%, and hotels, which account for 12.4% of the group’s total volume of waste. Other commercial property had a sorting rate of 48.0% in 2022. The hotels had an average sorting rate of 51.5% in 2022.
It is particularly important that these three business areas perform terms of sorting rate. Without a good performance of these business areas, it will not be possible to achieve the goal of becoming 70% circular by 2030. With an average sorting rate of 56.0% at group level, it is clear that hotels and other commercial real estate drag down the average, while shopping centres keep it up. The challenge with the shopping centres, as well as other commercial real estate, is that the sorting rate is largely dependent on the tenant's efforts. Therefore, it is important to have a good collaboration with the tenants, where the Olav Thon Group is responsible for ensuring that good waste management is facilitated, while the tenant is responsible for ensuring that good waste management is carried out in practice.
Both the other14 business areas and hotels had an increase in the average sorting rate. The reopening of several hotels after they have been closed during the pandemic has probably led to a change in the proportion of the various waste fractions. Among other things, it is conceivable that the proportion of food waste, which is a sorted waste fraction, is reduced to a certain extent by fewer guests at the hotel. As a result, the proportion of food waste may have increased when the hotels reopened. Similarly, this may have reduced the proportion of residual waste, an unsorted waste fraction, which is reflected in an increased sorting rate.
In addition, 41.8% of the waste went to energy recovery. The main part of the waste that goes to energy recovery is residual waste. The consequence of a high sorting rate is therefore a higher proportion of material recovery, which is regarded as more sustainable than energy recovery. In addition, 1.2% of waste goes to landfill.
FUTURE OUTLOOK
In accordance with the Olav Thon Group’s sustainability strategy, we aim to become 70% circular by the end of 2030. This means, among other things, that we must work
emissions and a growing circular economy.
In 2022, the average sorting rate was 56.0%. This is a decrease of 0.3 percentage points compared with the previous year when the sorting rate was 56.3%. The Olav Thon Group aims to become 70% circular by 2030. This is therefore considered a development in the wrong direction if we are to achieve this goal.
Shopping centres still account for the largest proportion of the total volume of waste. In 2022, the shopping centres in the Olav Thon Group had just under 20,000 tonnes of waste. This corresponds to 70.3% of the total volume of
TREATMENT METHODS
The treatment of waste has an impact on our greenhouse gas emissions, and our contribution to the circular economy. The possibility of further treatment of the waste depends on sorting the waste in clean fractions. This is therefore closely linked to our sorting rate performance.
In collaboration with our suppliers of waste disposal, we can generally gain insight into the treatment methods for the various fractions. This allows us to calculate how much of the waste is recovered, as well as in what way the materials are recovered. In 2022, 56.9% of reported waste went to material recovery. This is an increase from 50.2% the previous year. Waste that goes to material recovery is recirculated into new materials. This reduces the need for virgin materials, which in turn reduces the use of natural resources.
towards a sorting rate of 70%. As mentioned, an increased sorting rate also depends on the effort and willingness of our tenants and how they set their preferences regarding waste management. Therefore, the group’s sub-goals focus on encouraging our tenants to achieve a 70% sorting rate. This must be done by requiring tenants at shopping centres and commercial real estate commit to increasing their sorting rate. In 2023, we will require them to commit to a sorting rate of 60%, in 2027 65%, and in 2030 70%. This means that the tenant does not necessarily have to have a sorting rate of 60% in 2023, but we require them to strive for this level.
WASTE MANAGEMENT PROJECT
In 2020, the Olav Thon Group entered into an agreement with Carrot (formerly Waste IQ) for a pilot project at Vestkanten Storsenter. The project aimed to test new solutions for recording and tracking of waste at shopping centres with the main goal of reducing the proportion of residual waste. In addition, the project aimed to provide a picture of which fractions exist in a shopping centre and experiment with which downstream solutions can be found and/or developed for these fractions. This way you can increase the circular aspect of the shopping centre's operations.
The project was expanded in time and was also ongoing in 2022. The results show that the project is very successful and has resulted in a large decrease in residual waste at the shopping centre. Before the project started,
13 Other commercial real estate: office, commercial real estate, logistics, parking, centre association, housing and operating property (also includes the previous division Adm./Head office)
14 Other: Unger Fabrikker AS and Follo Fjernvarme AS
Percent SORTING RATE 60 50 40 30 20 10 0 2015 2018 2017 2016 2021 2020 2019 47.7% 46.0% 48.6% 56.3% 54.9% 51.6% 49.7% 2022 56.0% WASTE VOLUME Tonnes 35,000 30,000 25,000 20,000 15,000 10,000 5,000 0 2015 2018 2017 2016 2022 2020 2019 Hazardous waste Non-hazardous waste 30,620 29,482 29,014 30,743 25,387 28,919 24,528 98 83 89 73 96 468 532 28,272 625 2021
Business area Sor�ng rate Housing rentals Other commercial property Hotels Shopping centres Other 29.4% 48.0% 51.5% 57.4% 90.9% Total 56.0% Waste volume (kg) 183,177 4,002,906 3,518,067 19,875,337 692,241 28,271,728
WASTE TREATMENT Percent 1.2% 56.9% 41.8% Energy recovery Material recovery Landfill
46 47
Vestkanten Storsenter had a sorting rate of 54%. By the end of 2022, the average sorting rate increased 65.5%. This is an increase of as much as 11.5%. The solution has made it easier to engage tenants to sort and handle the waste better. Our operators get easier and faster access to waste data through an actual current picture, which makes it possible to address deviations immediately. This creates a closer collaboration with the tenants, which in turn contributes to increased sorting and cleaner fractions.
Due to the project's success, it is planned to expand cooperation in 2023. Vestkanten Storsenter has this as a permanent solution for waste management. In addition, several other shopping centres have started their own pilot projects.
In addition, in accordance with the sustainability strategy, we will expand our waste management project to include all shopping centres by the end of 2027. This is because we have seen the effect of this in some shopping centres and see that it helps to increase the sorting rate. By the end of 2023, our goal is to have expanded the project to 15% of all our shopping centres.
Food waste
Since 2017, Thon Hotels has focused on reducing food waste, among other things, by using smaller plates in the buffet so that guests do not help themselves to a lot more food than they eat. In addition, some of the hotels have started to record how much food waste is thrown away. Food waste is the part of food waste that consists of the edible food. Shells and bone residues are not considered food waste, as these are waste that would not have been eaten anyway.
In 2019, 42 hotels entered into a partnership with eSmiley, an operator that records food waste. The data we get from this system depends on the usage at the individual hotels. Therefore, the quality may be poor. We are constantly working on improving the use of the system to ensure better data quality. In 2022, we see that some of the hotels have a suspiciously low level of food waste. This is probably due to insufficient recorded food waste. Based on the data recorded from 2022, the active hotels had food waste of 179,795 kg. This is on average 4,280 kg per hotel.
TOO GOOD TO GO
Since 2016, Thon Hotels has had a collaboration agreement with Too Good To Go, which provides a solution to reduce food waste. They help restaurants and other food outlets to sell surplus food. In short, this is done by the participating hotels being registered in the Too Good To Go app, where it is possible to order
THON GJENBRUK
In 2020, the Olav Thon Group established the company Thon Gjenbruk AS. This is a new recovery concept where the Olav Thon Group collects surplus goods and equipment from its own projects, which are mainly sought to be reused in their own projects. The concept also stipulates that the goods can be sold externally, if appropriate. The initiative is established in Norway, where the majority of the Olav Thon Group’s activities are also located.
The main purpose of Thon Gjenbruk is to minimise the amount of waste in real estate projects in the group. The Olav Thon Group is present in large parts of Norway. Efforts are therefore made to transport the goods as little as possible. Collection for intermediate storage for use in a separate project, or sale to external parties, is therefore made from the construction site where the refurbishment has taken place.
The company has so far had limited activity. Therefore, the goal has now been set to expand the area of use to Thon Gjenbruk in 2023.
Circular buildings
surplus food. This food can generally be picked up in a short period of time right after the restaurant closes and involves little extra work for our employees. The main purpose of this measure is to reduce food waste after the food has been prepared.
The most important thing you as a food supplier can do is to cut the waste in production, but when you have food left over, Too Good To Go is a measure that makes it possible to avoid this surplus food becoming waste. This is good for the environment and for the economy, both for us and for those who use Too Good To Go.
FUTURE OUTLOOK
In the Olav Thon Group’s sustainability strategy, it has been decided that we will reduce food waste by 25% by 2023 and 50% by 2030. Performance is measured against a reference year. As we are unable to calculate back to a reference year due to poor data quality, the goal will be calculated based on an industry average.
In addition, we expect the hotels to be better at recording food waste in order to improve the quality of the data, and for more hotels to participate. Better recording of data and better quality of data will lead to higher reported food waste per year. However, this will not have an impact on performance in relation to the goal, as the goal is based on external data.
The construction industry produces a lot of waste and requires large quantities of materials, which is both emission- and resource-intensive. The Olav Thon Group’s projects involve the development of buildings. This type of project requires input in the form of building material. With high consumption of materials, the Olav Thon Group puts pressure on, and use of, natural resources. Furthermore, there is a lot of waste associated with renovations. This waste consists largely of building materials, furniture and fittings. Such waste increases greenhouse gas emissions associated with the business. To minimise this negative impact on natural resources and emissions, it is essential for the Olav Thon Group to find circular solutions for its buildings.
Regulatory requirements for circular solutions in buildings are increasing. Circular principles for restoration,
CIRCULAR BUILDINGS
Establish a working group to map upcoming requirements for circular solu�ons in buildings
Include in the project design phase that opportuni�es related to reuse and end-of-life for building materials are explored
Require that the reuse rate of non-hazardous waste in construc�on projects is in line with the EU taxonomy for climate (70%)
Map current and poten�al for use of recirculated materials in construc�on projects
demolition and new builds are making their way into legislation in both Norway and the EU. Among other things, the EU has a target of 70% recovery in the construction industry and sets legal requirements for recycling rates and maximum waste volumes through the EU taxonomy.
As a consequence of regulations and taxes on virgin building materials, there may be an increasing risk related to changes in availability and the price of necessary resources and materials. It is therefore important for the Olav Thon Group to look at the opportunities we have to increase our rate of reused materials. This is necessary in order to avoid increasing the risk of stranded assets15 and increasing the possibility of better financing terms. Therefore, circular buildings are regarded as an important topic for the Olav Thon Group.
Require that the reuse rate of non-hazardous waste in construc�on projects is in line with the EU taxonomy for climate (90%)
Reuse rate of non-hazardous waste in construc�on projects is in line with the EU taxonomy for climate (90%)
70% circular by 2030
Set requirements for the propor�on of reused materials to be in line with the EU taxonomy for circular economy (30%)
Percentage of reused materials in line with the EU taxonomy for circular economy (30%)
Reusing materials minimises the need for virgin materials and therefore results in less pressure on natural resources. In order to minimise the impact on the climate and nature, it is essential for the Olav Thon Group to look at opportunities for circular buildings.
2023 2025 2027 2030
15 properties that lose value because they fail to meet market expectations or the regulatory standards 48 49
Future outlook
In 2023, a working group will be established for circular solutions in buildings. Among other things, this working group will identify the current and potential use of recirculated materials in construction projects. At our construction sites, we use hired contractors who are responsible for the physical execution of building renovation. This also involves the purchase of various building materials. This requires good cooperation with our contractors to achieve our 2030 target of a 30% rate of reused materials, which is in line with the EU taxonomy for the circular economy. In 2023, it is expected that this work will start by ensuring that opportunities related to reuse and "end-of-life" for building materials are explored are included in the planning phase.
Furthermore, we will require the reuse rate of nonhazardous waste in construction projects to be 70%. This is a goal in line with the EU taxonomy for climate. Currently we do not have any data on waste from our construction sites. Getting this insight requires good cooperation with both our renovators and our contractors. This work is expected to start in 2023. When previously collecting data, we have found that the data quality of new sources is often variable. It is therefore important to ensure that the quality of waste data from construction projects is good, and we expect a constant focus on improving the data. We expect to start getting some overview of waste from construction sites during 2023.
50 Thon Hotel Ålesund
Inclusive workplace
As the Olav Thon Group is a large employer with many employees, it is essential that it is an inclusive workplace so employees are happy to be at work. In the Olav Thon Group, we strive for real equality and good diversity among our employees.
The Olav Thon Group has an impact on the workplace the group creates through how it works with equality, inclusion and diversity internally. With its own HR and HSE department, the group focuses on how best to look after its employees by focusing on equality, inclusion, diversity, health, attendance and safety.
There is increasing demand for transparency regarding equality and diversity among employees and management in our own activities. There is also an increased focus on diversity and anti-discrimination in the workplace. A lack of focus on an inclusive culture in the group can affect our attractiveness as an employer and a sense of belonging among employees. In addition, discrimination, as well as a lack of equal opportunities and pay for
employees, can increase reputational risk and reduce trust among employees. Employees who experience personal development stay longer in the job and perform better. In addition, young applicants and employees are attracted to responsible employers, and it has been shown that diversified companies perform better than companies that are not as diversified.
By focusing on equality, diversity and inclusion, the Olav Thon Group has the opportunity to have a positive impact in the workplace and create a working environment where employees want to be. We must therefore work actively, purposefully and systematically to promote equality, diversity and inclusion, and prevent discrimination.
SOCIAL JUSTICE
The work is included in the company’s HR and HSE work. It is a continuous work that must be taken care of throughout the employment relationship, from the recruitment of new employees to the end of the employment relationship, for each individual employee at all levels in the entire group.
INCLUSIVE WORKPLACE Representa�ve management Create a working group for equality, inclusion and diversity Strategy for equality, inclusion and diversity 40% of each gender overall and on management levels 1–3 2023 2025 2027 2030 Hire a manager for equality, inclusion and diversity Report on transparency, diversity and equality
of each gender
Group
40%
on the board of the OTG
53
The work and goals involving equality, diversity and inclusion are anchored in several overarching documents. These documents include:
• Code of ethics in the Olav Thon Group
• Sustainability policy
• Group instructions for personnel policy
• The group's management instructions for personnel management
• Diversity and equality work in the Olav Thon Group
• Warning poster
In 2018, we prepared new guidelines for systematising diversity and gender equality work with the aim of promoting gender equality and preventing discrimination. The guidelines are described in the document "Diversity and gender equality work in the Olav Thon Group". This document was updated in 2020. Considerations of equality and nondiscrimination are otherwise included in the other personnel policy and described in all relevant parts of our policies and personnel handbooks.
The whistleblowing poster is a document that describes the company’s procedures for reporting in the event of perceived discrimination, harassment or bullying. The document is based on the fact that in the Olav Thon Group all people are equally valuable and there should therefore be no discrimination, harassment or bullying. The threshold must be low to report matters worthy of criticism, and everyone must be taken seriously if they feel exposed to such things. Find out more about our whistleblowing channel on page 10.
The HR department prepares an annual gender equality report for the Olav Thon Group in accordance with the activity and reporting obligation. For more information about this, visit the Olav Thon Group’s website.
In order to systematise the equality, inclusion and diversity work, it has been decided in the sustainability strategy that a working group will be established for this work during 2023. The main responsibility for the working group lies with the HR department, but representatives from several parts of the group shall be included. Over the course of the year, the working group will draw up a strategy for the work on equality, inclusion and diversity. The strategy will be a guide to how the Olav Thon Group will work with equality, inclusion and diversity in the years leading up to 2030, to ensure that we are an inclusive workplace. In addition, this will help us towards achieving our ambition of having a representative management.
Gender and age
The Olav Thon Group has worked for equality and diversity among employees for a long time. This means that we can demonstrate an even gender and age distribution.
In 2022, the Olav Thon Group had 3,587 employees. The figure includes the number of persons with either permanent or temporary employment within the Olav Thon Group, in the companies managed in our central HR system. See the appendix (p. 58) for more information about the data. There is an increase in the number of employees from 2021 to 2022 of 21%. The main reason for this is probably that after the reopening of society in 2022, new employees had to be recruited to both hotels and restaurants, after a couple of years of lockdown and downsizing. Hotels and restaurants account for over 70% of all employees in the group, and consequently the pandemic has had a significant effect on the number of employees in the group as a whole.
The figures are based on the number of persons within the Olav Thon Group, in the companies managed in our HR system. See the appendix for more information about the data (p. 70).
TURNOVER
The Olav Thon Group had a turnover rate of 47% in 2022. This is probably also linked to the fact that such a large proportion of the Olav Thon Group’s employees work in the hotel and restaurant industry. This is an industry characterised by a high turnover rate. This is thought to be due to many young employees, especially students, who often only hold the position for a short period of time. Similarly, we can also see that the age group under 30 had a turnover rate of 84% in 2022, which is particularly high. This is thought to be due to the corona pandemic, which may have led to furloughs, termination of employment and uncertainty in the hotel and restaurant industry. The age group above 50 was the group with the lowest turnover rate of 19%.
In addition, the data shows that women in the Olav Thon Group have a higher turnover rate than men with 50% versus 43%. This probably has something to do with the fact that there is a large proportion of young women in the group, and the turnover rate was very high for the age group under 30. In addition, there is a higher proportion of women than men among our employees in hotels and restaurants.
GENDER DISTRIBUTION
In 2022, 52% were women and 48% were men who worked for the Olav Thon Group. This is a very even distribution of gender in the group. Despite the fact that the turnover in the group has been very high over the past year, this is a similar gender distribution to the previous year.
This even gender distribution is also reflected in the gender distribution among managers. Of all managers in the Olav Thon Group, there were 48.9% women and 51.1% men. There has been a very even gender distribution in recent years among managers in the Olav Thon Group. In 2021, there were 47.2% women and 52.8% men in management positions. However, we have seen that there have been the greatest differences among top managers. In 2022, there was a very even gender distribution among middle managers, with 50.4% women and 49.6% men. Among top managers, on the other hand, this was more uneven with 45.7% women and 54.3% men. This indicates that the gender distribution is more uneven, the higher up in a management position you go.
In addition, the division of top and middle managers is not entirely representative of the actual positions. This is part of the reason why, with new goals in the sustainability strategy, we have chosen to define the management levels in a new and more representative way, and with this focus on the top management levels 1-3. This division of management levels underlines previous findings of an uneven gender distribution at top management levels.
At management level 1, the biggest difference is with 16.7% women. This is not surprising, as this is also the smallest group and a small number will make a big difference percentage-wise. The gender distribution at level 2 is slightly more even with 36.4% women and 63.6% men. It is only at level 3 that we can see a relatively even gender distribution with 43.2% women and 56.8% men.
The Olav Thon Group aims to have 40% of each gender in all three management levels, and in total in management levels 1–3 by 2030. The management levels 1–3 overall have 38.5% women and 61.5% men. At present, only management level 3 has achieved 40% or more of each gender with 43.2% women and 56.8% men. The uneven gender distribution that is at management level 1 (16.7% females) and 2, (36.4% females) shows that the higher up you go in management levels, the lower the proportion of women represented. In order to achieve our ambition of a representative management, it is essential that the even gender distribution in the group is also reflected in the top management levels.
In addition, the board of the Olav Thon Group must have a gender balance of at least 40% of each gender. As of 2022, this distribution is 22.2% women and 77.8% men.
AGE DISTRIBUTION
The Olav Thon Group has a relatively even age distribution. Nevertheless, the 30–50 age group comprises
almost half of all employees in the group with a 48% share. A likely explanation of this can be that there is an age group where a greater proportion of the age group in general is in work.
The second largest age group is employees under the age of 30. Employees under the age of 30 are 34% of the group’s employees. Compared to 2021, this share has increased by 4.4 percentage points. This is considered to be linked to the reopening and recruitment of new employees at our hotels. 82% of all employees under the age of 30 work at our hotels and restaurants.
In comparison, employees over the age of 50 comprised 18% of the group’s employees in 2022. This is a decrease
GENDER DISTRIBUTION AMONG MANAGERS LEVELS 1�3 Women Men 20 15 10 5 0 Level 1 Level 2 9 16 21 25 Quan�ty Level 3 1 5 25 30–50 Under 30 Over 50 Percent AGE DISTRIBUTION 48% 18% 34%
Men Women Percent GENDER DISTRIBUTION 48% 52%
54 55
of 3 percentage points compared to the previous year. We consider this to be a natural result when the age group under the age of 30 had many new employees.
If we look at age in the context of gender, it appears that in the 30-50 age group, the gender distribution is relatively even. In the below 30 age group, there are significantly more women than men, but in the over 50 age group there are more men than women. This could be a possible explanation of why there are more men in management positions at levels 1–3 than women. Given that management positions are offered to those with the most expertise and experience, it can be assumed that there are more managers among the top age groups. When there are also more men than women in this age group, the probability of a male manager may increase.
Health, safety and the environment
The health, safety and environment work (HSE) in the Olav Thon Group aims to create safe and secure companies with good working conditions and well-being among employees and managers. This work is related to the group's work with workers rights.
ABOUT THE HSE WORK
The HSE vision for the group is "visible focus on health, environment and safety". The Olav Thon Group works to have a uniform, simple and effective system for the HSE work. Among other things, a common HSE system has been developed for the entire Olav Thon Group. Plans, procedures and guidelines are drawn up to meet legal requirements and contribute to achieving HSE goals and performance requirements. The group’s HSE goals include:
• We will strengthen the safety culture internally
• No serious injuries
• Lower sick leave than the national average
• Satisfied and engaged employees
• Reduce the environmental impact
In addition, an action plan is prepared annually for the HSE work in the coming year, as well as an internal annual report for the past year.
Various types of risk assessment are carried out in the group’s divisions/units. The method is chosen based on what is to be risk assessed: building stock, technical installations, fire, safety and accessibility, working conditions or working environment. Procedures have been prepared for the different methods.
All employees also have access to the Olav Thon Group’s HSE handbook. The handbook is central to the company’s internal control and HSE system.
ORGANISATION
The group management is the highest body for HSE matters. The key guidelines are taken further in the Working Environment Committee (WEC) in the various divisions and units.
The group management has a minimum of four HSE meetings per year where key guidelines for HSE work are prepared. The HSE department is delegated the professional responsibility for the systematic HSE work in the group. The department offers all of the group’s units and companies professional, operational support and training, and helps to carry out assessments of health and ergonomic conditions in the workplace.
The group HSE manager leads the health, safety and environment work and has established a network with working environment committees at company level. The local unit managers are responsible for HSE in their unit and have a duty to follow up requirements in HSE legislation.
WORKING ENVIRONMENT COMMITTEE
The WEC is a decision-making and advisory body tasked with implementing health and safety legislation in the company. The committee must participate in the planning
of the protection and environmental work in the company and closely monitor developments in the working environment. There are a total of 13 working environment committees in the Olav Thon Group.
There is one central WEC for hotels and restaurants. In addition, there are 12 local WECs, nine of which are affiliated with Thon Hotels. More than 90% of the group's employees are represented via a formal WEC.
SICKNESS ABSENCES
Sickness absences at the Olav Thon Group was 6.45% in 2022, while the national average was 6.80%. The figures include both self-reported and doctor-certified sickness absences. In comparison, there has been an increase of 1.46 percentage points from 2021 when sickness absence was 4.99%.
After two years with a more or less closed society, home office and little social contact, society has now reopened. This leads to more social contact by returning employees to the office and being more susceptible to the spread of various diseases we were protected from in 2021. The increase in the rate of sickness absence is therefore considered to be related to an increased normal state in society.
ATTENDANCE
When we know the sickness absence percentage for a given period, we also have the attendance percentage for the same period. The attendance percentage tells us how many of the employees have been at work and deals with factors such as belonging, loyalty, collegiality, motivation, professional pride, responsibility, being able to utilise their own prerequisites, leadership skills and caring for each other. In 2022, this was 93.55%.
To increase the attendance in the Olav Thon Group, sickness absence is always on the agenda in each WEC. The occupational health service related to Thon Hotels, Resthon and Thon Bygg AS follows up units that have too low attendance and assists in initiating measures
to increase this. In addition, local social activities are arranged that promote a better working environment.
Unit/division Number of man-years Sickness absences 2022
Amfi Group
Conrad Langaard
Follo Fjernvarme
Head office1
Hotel division2 Shopping centre division3
AS
1 Includes Thon Hotels AS/Thon Hotels Salg AS/Thon Holding AS/ Time Park AS/Time Park Service AS/Norsk Pantelotteri AS/Norsk Underholdningsspill AS.
2 Includes all operating companies belonging to Thon Hotels AS (incl. Sweden/Belgium/Netherlands/Vettre Hotelldrift AS/Linne Hotell AS/ Hotell Bristol AS).
3 Includes Olav Thon Eiendomsselskap ASA/Gardermoen Park AS/Bergen Storsenter AS/Amfi group/Vestkanten AS/Sartor Storsenter AS/Østerås Kjøpesenter AS/Åsane Storsenter DA/Thon Ski AS/Thon Sverige AB group/ Thon Fastigheter AB group.
AGE AND GENDER DISTRIBUTION 800 700 600 500 400 300 200 100 0 Under 30 years 31-49 years Over 50 years Men Women 719 485 862 840 259 367 Quan�ty 900
OTG WEC IR commi�ee AKAN Conrad Langaard Thon Eiendom Head Office Time Park Thon Hotels Resthon Olav Thon Eiendomsselskap ASA Follo Fjernvarme Unger Fabrikker ORGANISATION HSE WORK
HSE Group
WEC, Hotel&Rest WEC, Head Office
WEC, Opera�ng personnel and tradesmen
WEC, Surnadal Office
Units without their own WEC
Hotels with their own WEC
Other businesses:
Unger Fabrikker Conrad Langaard Follo Fjernvarme
ORGANISATION WEC
Unger Fabrikker 163 11 4 381 1,623 264 111 54 119 4.92% 8.86% 3.32% 6.08% 9.82% 6.40% 6.44% 7.36% 5.30%
Resthon
Thon Eiendomsservice AS
56 57
Employee development
As part of the Olav Thon Group’s work with social issues and workers rights, the group works continuously with employee development. This entails courses and training opportunities that are put in the system and followed up by the HR department.
COURSES AND SKILLS DEVELOPMENT
Facilitating courses and skills development is important for the group’s development and the HR department that is responsible for this area. Information about courses and registration is communicated via a separate course portal. The group’s course catalogue consists of around 70 different courses and e-learnings within first aid, safety and emergency preparedness, IT security and privacy, systems training, food and beverage, HSE, management, IT systems, sales, introduction day for new employees, and service.
In 2022, there were a total of 3,444 course participations in 112 courses and 12 e-learnings. This is a major increase in both the number of courses and e-learning, which in 2021 was 38, and the number of course participations, which in 2021 was 1,307. The increase is probably due to the fact that the company’s day-to-day operations are no longer affected by the corona pandemic, and it was therefore possible to hold more courses.
F&B SCHOOL
In 2016, courses were arranged for the first time under the auspices of the F&B (food and beverage) school. This is an internal training school with a focus on food and
Social responsibility
The Olav Thon Group works continuously to be an inclusive employer and create diverse jobs. This is reflected in the group's recruitment process, but also in collaboration with various players who work to create inclusive jobs.
RINGER I VANNET (RIPPLES IN THE WATER)
Ringer Vannet was a work and inclusion project under the auspices of the NHO (The Confederation of Norwegian Enterprise). The purpose of the project was to encourage unemployed people into NHO companies. Ringer i Vannet is based on a local collaboration between companies and work and inclusion companies that operate in the same local community. Ringer Vannet has now entered a phase where it has been established as a method for inclusive working life and it is further managed by the work and inclusion companies themselves.
drink for the employees of Thon Hotels and Resthon. The school consists of several levels and in 2016 the first grade was launched. The first grade is a three-day course that addresses the basics required of a good service employee. Every day has its focus area - wine, beer and spirits.
EDUCATION SCHOLARSHIP
In collaboration with several of our suppliers, we have the opportunity to offer support/scholarships to our employees in Thon Hotels and Resthon through the Education Fund. The scholarship is for those who want to gain more knowledge in a special field they work in and are passionate about. This can, for example, be a course in restaurant management, as a beer waiter, as a wine sommelier or a trade certificate as a private student.
APPRENTICES
It is becoming increasingly important for the hotel industry to attract apprentices, both to support professionalism in the industry and because the public sector sets ever stricter requirements for the use of apprentices in tendering contexts. In Thon Hotels, it is the hotels themselves that take the initiative to have apprentices, but there is an increasing focus in the central administration.
In 2022, 17 of our hotels were apprentice companies, which engaged 49 apprentices in the disciplines of chef, receptionist, waiter, confectioner and tourism. We regard these as good results and will continue to focus on the use of apprentices.
COLLABORATION WITH NAV OSLO
The Olav Thon Group has had a collaboration with NAV Bjerke in Oslo since 2013. As a result of the corona pandemic and lack of employees at Thon Hotels and Resthon, this collaboration has now been extended to NAV Oslo. Thon Hotels is at the forefront of this work, and contributes with work training, language training and a network, the hotels are linked to resources that can go to work quickly and Norwegian society benefits from the value creation that the individual employee contributes.
Since the summer of 2021, the co-operation with NAV has picked up considerably due to the industry's staffing challenges as a result of the pandemic. As a result, the Olav Thon Group had several appointments in the autumn of 2021. In addition, the collaboration with NAV has also contributed to more jobseekers receiving work training and practical experience at our units both at the head office, Resthon and at several of the hotels in Oslo.
In the autumn of 2021, we requested NAV to adapt its Café course to a more focused course for restaurants and bars. The reason is that there is a gap between experience and skills. By participating in this course, we offer an internship after the candidates have completed the academic theoretical part of four weeks. The purpose is to be able to provide job opportunities to people who
for various reasons are out of work and want to get into working life. Here it is required that the employee has a desire to work and that the employer has both an offer and an opportunity to accept different types of people who for various reasons are not part of ordinary working life. The project gives candidates opportunities to show themselves from a new side. The hotel industry has a lot to offer and the Olav Thon Group tries to show that there are many opportunities as long as you get one foot through the door. Hence we want to give this opportunity to more people.
The course was held in 2022 and led to the employment of 50% of the participants. The course has not yet been held again due to lack of resources. However, we continue our collaboration with NAV in such a way that they send potential candidates to our HR department, who are passed on to our hotels and restaurants. We also participate in various company visits and have company presentations mainly for candidates for job training and language training in work situations where we are the company in question to host. Going forward, we will also focus on looking after new employees through good training and follow-up. This is in the hope of securing them a permanent position in the workplace.
Thon Hotels signed an agreement with Ringer i Vannet in the autumn of 2017. Since then, 27 of the hotels have signed agreements with local work and inclusion companies. These agreements have resulted in 10 confirmed appointments in 2022 (51 since the start in 2017). This is considered to be very positive in a year where conditions in the labour market have been very unpredictable. According to Ringer in Vannet's studies, it means that every time a person is employed, it saves society NOK 10 million. This means that the work Thon Hotels is doing through Ringer i Vannet has already saved society NOK 510 million since the group agreement was signed in 2017.
Due to some poor data, there is also reason to believe that the number of people employed in 2022 was somewhat higher. Efforts are being made to improve this data to ensure quality in the future.
58 59
Human rights, transparency and responsible business practices
Companies' respect for working conditions and human rights in the value chain is increasingly gaining attention. The Olav Thon Group purchases goods and services for NOK 7–8 billion per year. This entails a great responsibility as a purchaser.
As a major buyer and property owner, the Olav Thon Group has the opportunity to influence conditions with regard to human rights and workers rights in the value chain. Based on which suppliers we choose to use and which products we choose to buy, we make choices that affect these conditions.
There is an increased focus and regulatory requirements to ensure workers rights and human rights in the supply chain and its own operations. The Norwegian Transparency Act that came into force in 2022 is an example of this. In addition, the EU will also have more requirements in the future, which will ensure that we gain better insight into the value chain. Consumers, investors and other stakeholders expect, to a greater extent than
before, access to information regarding responsible business practices. It is expected that we have both more information about conditions in the value chain and that we are more open about them.
We purchase many different products and services from many different suppliers. Consequently, this also includes many different supply chains. This makes it challenging to keep track of conditions at all levels. In addition, the construction industry is one of the industries with the most work-related crime and most reported work accidents. The industry is associated with a high risk of health and safety violations, a lack of trade union organisation and low wages.
By mapping value chains and risk assessing our purchases, we have the opportunity to reduce the risk of violations of human rights and workers rights. It can also help us uncover irresponsible conditions in the value chain. Insights into the value chain can lead to a positive change in our supply chains, as well as constantly acquiring new knowledge and information that helps us to be transparent with our customers and tenants. This gives
the end user the opportunity to buy more ethically. Hence, both human rights and transparency, as well as responsible business practices, are important topics for the Olav Thon Group. These two themes are closely interlinked, and the work on the themes is often overlapping.
Human rights and transparency
The Olav Thon Group has set requirements for suppliers with regard to human rights, workers rights, climate and nature, and anti-corruption since 2016. This has been followed up annually with a supplier survey and subsequent dialogues with suppliers. In 2022, as a result of the Norwegian Transparency Act and the sustainability strategy, we were given greater responsibility with regard to human rights and transparency in the value chain. Consequently, we have focused on more systematic work to ensure that human rights and workers rights are respected throughout the group’s value chain.
THE NORWEGIAN TRANSPARENCY ACT
In 2022, the Norwegian Transparency Act came into force, which obliged the Olav Thon Group to work further on human rights and transparency. We spent the first half of the year preparing for and facilitating compliance with the Norwegian Transparency Act.
A landing page was created in 2022 for the Norwegian Transparency Act on the Olav Thon Group website This is initially intended as a contact point for those who want information regarding human rights, workers rights and responsible business practices in the Olav Thon Group’s value chain.
Internal procedures were also drawn up for how the group handles incoming information requests. The procedures include division of responsibilities and flow of information.
In 2022, the Olav Thon Group became a member of Etisk Handel Norge (Ethical Trading Initiative) – a member organisation and a resource centre for sustainable trade. They aim to promote responsible business practices in supply chains so that trade contributes to safeguarding human and workers rights, society and the environment. We believe that the membership helps us in our work with due diligence assessments and responsible business practices.
FIRMLY EMBED HUMAN RIGHTS
To ensure that human rights and workers rights are respected throughout the Olav Thon Group's value chain, policies, guidelines and ethical requirements have been developed for both our own employees and suppliers.
The Olav Thon Group works with category-based procurement. A procurement policy has been drawn up as well as thorough procedures for supplier selection. This includes mapping of several aspects of social responsibility, relevant to the individual categories, where these considerations are integrated.
The Olav Thon Group has drawn up a separate set of ethical requirements that place strict requirements on suppliers and subcontractors. The requirements focus on human rights, working conditions, the environment, anti-corruption, and improvement work related to these topics. These are attached as appendices to all our supplier agreements. When calling for tenders and concluding agreements, they are reviewed prior to any signing. It is noted that the supplier must fulfil these requirements and/or have a good account of how they strive to fulfil them. Find out more about our ethical requirements on page 26.
In 2019, a code of ethics was drawn up for employees in the Olav Thon Group. These must ensure that all employees in the group employ our shared values in all parts of our work, including respect for human rights and workers rights. Find out more about our code of ethics on page 26 or on the Olav Thon Group’s website.
HUMAN RIGHTS, TRANSPARENCY AND RESPONSIBLE BUSINESS PRACTICES Full insight into the value chain Human rights policy, code of conduct, ethical purchasing requirements in line with the Norwegian Transparency Act Landing page for human rights and public request management system Report on transparency, diversity and equality 2023 2025 2027 2030 Ethical purchasing strategy and procedures implemented Supply chain mapping for 1–3 product categories Conduct an overall risk assessment Separate guidelines for high-risk human rights viola�ons Supply chain mapping for 50% of product categories Supply chain mapping for 100% of product categories
60 61
DETECTED BREACHES OF THE CODE OF ETHICS
Responsible business practices in the value chain
To ensure that we actually strive for responsible business practices, we need to gain better insight into the value chain. This is done in accordance with the Norwegian Transparency Act through due diligence assessments. In 2022, this work began with mapping and a risk assessment. In addition, we conduct an annual supplier survey.
ANNUAL SUPPLIER SURVEY
Every year, the Olav Thon Group carries out checks of the supply chain. In 2019, we entered into an agreement with Factlines to ensure a broader and more systematic follow-up of the supply chain. The annual check is a survey that has previously been sent out to approximately 100 suppliers. These suppliers have been selected on the basis of the supplier category, results of previous surveys and any incidents related to the suppliers. In 2022, the survey was sent out to all contract suppliers. This is equivalent to 330 suppliers. The decision is based on an increased commitment to gaining insight.
In 2022, the supplier survey was conducted in Q2 and Q3. It had a response rate of 61%, compared with 91% in 2021 and 88% in 2020. The main reason for this is that we included all our contract suppliers. A good number of the suppliers are smaller service providers, sometimes with only one or two employees, which the survey does not take into account. One experience we have gained here is that next year we will have to look at the possibility of adapting the survey to different types of suppliers so that more people find it manageable to complete.
The survey awards points to each question based on the answers given. The average score was 74% of the possible top score. This is a decrease of 6 percentage points compared to the previous year. This can probably be justified by several suppliers, including smaller suppliers who do not have the capacity to acquire full insight into the value chain. The results show that a relatively high proportion have anchored accountability in terms of, among other things, the strategy for social responsibility or sustainability and the code of ethics.
It also became apparent that almost half of the suppliers who responded to the survey are suppliers without their own production facilities. Over 60% also buy products and services from suppliers with a combination of with and without their own production facilities. This suggests that there can be up to several links down to some of our first level producers14, which can make our supply chains long. Several links between us and our subcontractors will probably make it more challenging to obtain information as there is a certain distance between us.
Based on the answers in the supplier survey, our suppliers buy from a total of 40 different countries. There is reason to believe that this list is longer as not all suppliers responded. In addition, the survey requires you to enter only one country, but you can enter up to five countries. There is also no requirement for risk related to the country(s) chosen to be stated, and high-risk countries can therefore be ignored.
have given answers that should be followed up. This is done by our purchasing department in a meeting with the individual supplier.
RISK ASSESSMENT
Part two of due diligence assessments involves mapping and risk assessment of the supply chain. An overall risk assessment was carried out in which the supplier survey
Future outlook
In 2023, we are expected to continue our work with due diligence assessments in accordance with the Norwegian Transparency Act. After a year of experience, a process for due diligence assessments will be drawn up to ensure systematic and continuity of the work. In addition, the need for revision of existing processes, guidelines and policies must be assessed. These were revised in 2022, but we believe that it may be useful to revise them after one year of experience.
was viewed in connection with spend and production country per product category. The assessment was based on the different product categories rather than our suppliers to avoid the discussion and assessment being influenced by the business relationship and the cooperation we have with our suppliers. The risk score was then assessed against spend, which gives a picture of our impact and the extent of our impact.
The result of the risk assessment will be further used to identify where the need for further mapping is greatest. Following the risk assessment in 2022, it was decided that we should focus on construction companies and contractors, IT hardware and consultants, and dry goods. The level of severity of the risk in these categories is considered very high and the reversibility is relatively low. In addition, high spend indicates that there are categories in which we are a major purchaser. This means that both the extent and the impact can probably be high.
Our statement of the Norwegian Transparency Act is published annually on the Olav Thon Group website
12 suppliers responded that they have uncovered breaches of their code of ethics in the past 12 months. This corresponds to 6% of the suppliers who responded to the survey. This is an increase from 5%, i.e. 4 suppliers, in 2021. Of the 12 who have uncovered breaches in the past 12 months, 9 suppliers state that they have carried out improvement measures related to the code of ethics in the past 12 months. In 6 of these cases, the occurrence of forced labour, slave labour or involuntary work at subcontractors have been uncovered, and improvement measures have been implemented.
To questions that follow up on compliance with our ethical requirements for suppliers, the suppliers generally responded very positively. There are some suppliers who
We will continue with mapping and risk assessment of our supply chain. The goal for 2023 is to map the supply chain into 1–3 product categories (at a more granular level than the previous risk assessment). Whether it will be one, two or three product categories depends on how demanding it is to map one supply chain. This is an area we have little experience with from before, and there is therefore some
uncertainty related to this goal. In 2022, we selected three product categories that we want to focus on. However, these are not specific enough to map the supply chains. It will therefore be necessary to carry out further risk assessments to specify which product categories’ supply chains will be mapped in 2023.
In addition, a goal has been set to establish a landing page for the Norwegian Transparency Act on the Olav Thon Group’s website. The landing page itself was published in 2022, before the Norwegian Transparency Act came into force to ensure a point of contact for anyone wishing to contact us in connection with the Norwegian Transparency Act. It is expected that this will be further developed so that it becomes a page with information about our value chain and how we work with due diligence assessments.
14 The first level producer is our nearest producer link, i.e. where the product is produced/completed.
Producer with own facili�es A combina�on Percent OUR CONTRACTED SUPPLIERS 49% 40% 11%
Supplier without own produc�on premises
Top 5 high risk countries* COUNTRIES OLAV THON GROUP’S SUPPLIERS TRADE FROM BASED ON SELF�DECLARATION Turkey China Pakistan Malaysia India * Based on risk score of ITCU ra�ng and number of suppliers listed in the country Top 3 countries Sweden Norway Germany
No detected viola�ons in the past 12 months Detected viola�ons in the last 12 months Don't know Percent
85% 9% 6%
62 63
UN Global Compact
The Global Compact is the UN's initiative for cooperation with the business community in sustainable development. The letter below was sent to the then UN Secretary-General, H.E. Ban Ki-moon and confirms that the Olav Thon Group is a participant in the Global Compact initiative and that the group promises to integrate the ten basic principles into its strategy and daily operations. The next letter is a confirmation that the Olav Thon Group is still a Signatory in the UN Global Compact initiative and that the group's work will be presented in an annual report (Communication on Progress).

64 65
GRI index
The Olav Thon Group's sustainability report for 2022 has been prepared in accordance with GRI Standards for sustainability reporting. Below is a general account of the Olav Thon Group, following the template of the Global Reporting Initiative (GRI).
GRI 2 – General information
ORGANISATION AND REPORTING PRACTICES
GRI 2-1 Organisational details
GRI 2-2 Units included in the sustainability report
GRI 2-3 Reporting period, frequency and point of contact
GRI 2-4 Information implementation
GRI 2-5 External audit
ACTIVITIES AND WORKERS
GRI 2-6 Activities, value chain and other business relationships
GRI 2-7 Employees
GRI 2-8 Workers who are not employees
GOVERNANCE
GRI 2-9 Management structure and composition
GRI 2-10 Nomination and election of the highest governance body
GRI 2-11 Head of the highest governance body
GRI 2-12 Role of the highest governing body in the management of impacts
GRI 2-13 Division of responsibilities
GRI 2-14 Role of the highest governance body in sustainability reporting
GRI 2-15 Conflicts of interest
GRI 2-16 Communication of misconduct
GRI 2-17 Knowledge of the highest governance body
GRI 2-18 Evaluation of the highest governance body’s performance
GRI 2-19 Guidelines for remuneration
GRI 2-20 Process for determining remuneration
GRI 2-21 Annual compensation rate
STRATEGY, GUIDELINES AND
PRACTICES
GRI 2-22 Sustainability strategy statement
GRI 2-23 Mandatory guidelines
GRI 2-24 Anchoring of mandatory guidelines
GRI 2-25 Process for compensating negative impact
GRI 2-26 Mechanisms for seeking advice and raising concerns
GRI 2-27 Compliance with laws and regulations
GRI 2-28 Membership in associations
Pages 7 and 9
Page 27
None
None Page 7-9
Page 7
Missing an overview
STAKEHOLDER ENGAGEMENT
GRI 2-29 Approach to stakeholder engagement
GRI 3 – Key topics
GRI 2-30
FINANCE
Collective agreements
GRI 201-1 Direct economic impact
TRANSITION TO A LOW-EMISSION SOCIETY
GRI 302-1 Energy consumption
a. 40,797 MWh (gasoline, diesel, propane, LPG, natural gas and light heating oil)
b. 30,441 MWh (pellets)
c. i. 268,232 MWh
ii. 109,125 MWh
iii. 15,346 MWh
iiii. No consumption of steam
d. i. No electricity sold
ii. 35,000 MWh
iii. 8,900 MWh
iiii. No steam sold
e. 420,041 MWh
f. Standards, methods and requirements: These points are described in the PDF The Olav Thon Group's 2022 Carbon Accounting Report on our website.
Page 12
Page 9-11
Page 9-10
Page 10
Page 18-20 and 25
Pages 18-20 and 25-26
Page 27
Page 10 Page 10
Page 10-11
Page 16
Page 10
Page 10Page 5
Page 26-27
Page 26-27
Page 10 No violations
Thon Hotels is a member of NHO Reiseliv Otherwise no such memberships
g. Conversions from volume to energy are taken fromThe Olav Thon Group's Carbon Accounting Report.
GRI 305-1 Direct greenhouse gas emissions (Scope 1)
a. 10,541 tCO2e
b. All are included
c. No biogenic emissions in scope 1
d. N/A
e. The GWPs used in the calculation of tCO2e are based on the Intergovernmental Panel on Climate Change (IPCC) Fourth Assessment Report (AR4) over a 100-year period.
f. Operational control and financial control
g. Standards, methods and requirements: These points are described in the documentation on our website
Page 34-35 Page 33
GRI 305-2
Energy-related indirect greenhouse gas emissions (Scope 2)
a. 10,732 tCO2e
b. 73,167 tCO2e
c. All are included
d. N/A
e. The GWPs used in the calculation of tCO2e are based on the Intergovernmental Panel on Climate Change (IPCC)
Fourth Assessment Report (AR4) over a 100-year period.
f. Operational control
Page 33-34
Page 16
Approx. 70%
66 67
g. Standards, methods and requirements: These points are described in the documentation on our website
GRI 305-3 Other indirect greenhouse gas emissions (Scope 3)
a. 8,794 tCO2e
b. All are included
c. No biogenic emissions in scope 3
d. Emissions in scope 3 are calculated for the following categories: waste (residual waste for incineration/sorting) and business trips (flights).
See page 16 of this report for figures by category.
e. N/A
f. The GWPs used in the calculation of tCO2e are based on the Intergovernmental Panel on Climate Change (IPCC) Fourth Assessment Report (AR4) over a 100-year period.
g. Standards, methods and requirements: These points are described in the documentation on our website
GRI 306-3 Waste overview
GRI 307-1 Failure to comply with environmental laws and regulations
GRI 403-1 Working environment committee
GRI 404-1 Education, training and advice
GRI 405-1 Age and gender distribution
GRI 406-1 Cases of discrimination
GRI 407-1 Follow-up of suppliers (freedom of association)
GRI 408-1 Follow-up of suppliers (abolish child labour)
Page 34
The appendix provides supplementary information on the various elements in this year's sustainability report.
FINANCIAL FIGURES
The Olav Thon Group reports in accordance with IFRS , which affects some of the reported figures on the group's financial contribution to society.
The reported figures have the following distribution:
Page 46-47
No known cases
Page 57
Page 58
Page 54-56
No known cases
Page 62-63
Page 62-63
• Revenue: The group's total operating revenues.
• Operating costs: Other operating costs and cost of goods.
• Employee salaries and benefits: Salary costs, as well as employer’s contributions and other personnel costs.
• Payment to suppliers of capital: Tax payable, correction tax in previous years and property tax.
• Investments in society: Investments in local communities in connection with construction projects and support for the Red Cross.
In 2022, NOK 195 million was invested in society, distributed as follows: NOK 76.6 million invested in local communities in connection with construction projects; NOK 116.7 million has been transferred to the Red Cross.
The Olav Thon Foundation's contribution to scientific research and charitable causes can be linked to the group's activities, as the contributions are taken from the Olav Thon Group's profits. These figures are reported in the Olav Thon Group’s sustainability report, and are not included in the calculation of the group’s investments in society in this report, as this report only covers the Olav Thon Group.
FIGURES WASTE
The figures for waste is collected from our suppliers for waste disposal. This mainly means that the figures come from Retura and Norsk Gjenvinning for waste in Norway, and Stena Recycling for waste in Sweden. In addition, we collect waste data from our hotels in Benelux. All waste figures have been obtained for the full calendar year 2022. The sorting rate is calculated on the basis of waste volume and represents the group’s sorting rate in its entirety.
The Olav Thon Group has an overview of which waste fractions are used in sorting at source. Different codes are used in the mapping of fractions depending on the country. In Norway NS codes are used, while in Sweden and the EU EAL codes are used. In addition, our supplier
for carbon accounting uses CEMAsys EC codes, which also state something about the emission factor of the various waste fractions. There is currently no key to the relationship between the different codes. As a result, the team in the Olav Thon Group and consultants from CEMAsys together made an attempt to form a relationship between these categories. This was necessary to find the relationship between the NS codes and the EAL codes. It was also important to link these to the EF codes, as it is the EF codes that determine the calculation variable for the conversion of waste volume to CO2 equivalents.
The treatment method comes per order line from Retura. For the rest of the waste we have carried out a survey of NS codes and the most common treatment methods for the various waste fractions. We received a list from Retura with NS codes and how they are treated (material recovery, energy recovery and landfill) which together with information on Norsk Gjenvinning’s website has formed the basis for this mapping.
Data from Retura and Norsk Gjenvinning are retrieved regularly from automated data. In 2021, order lines with waste unit kg and litres were included. Order lines with work, service and similar will then be excluded.
Food and residual waste from Sweden is managed by Swedish municipalities and these figures were excluded due to limited data access. We only have access to the number of waste collections, but not the actual volume of waste. Nor was an estimation made of what these figures could be. For future reporting, we will strive for ways to access this data on a monthly basis.
Waste management companies in Benelux do not have systems for weighing the waste, but the number of kilograms is based on the type of waste and the size of the waste container. Therefore, these figures are only an estimate and not the actual volume of waste.
FIGURES ENERGY
The reported figures account for the Olav Thon Group's total operations in Norway, Sweden and Benelux, including the group's own district heating company Follo Fjernvarme and Unger Fabrikker.
Our energy monitoring system (EOS), Energinet, is a tool for monitoring energy consumption to ensure good
68
Appendix
69
development and optimisation of the property. The data is collected from Energinet and loaded into our data warehouse, Thon Innsikt, via API. There is a small difference between the figures in Energinet and in Thon Innsikt. The reason for this is how the hierarchy of companies, properties and meters is structured compared to how an extract is made through an API. For example, a meter can be linked to several buildings but the distribution as a percentage cannot be collected. This means that data from a meter can be reported twice (or more).
Reported energy consumption is consumption excluding the tenant’s own consumption.
Conversions from actual consumption of petrol, diesel and propane to energy consumption (MWh) are taken from our carbon accounting.
FIGURES CARBON ACCOUNTING
The carbon accounting report has been prepared in collaboration with CEMAsys, who provide advice, as well as a solution for calculating the carbon footprint of the Olav Thon Group. The carbon accounting report is in accordance with the GHG protocol and use emission factors from the IPCC (AR4). An account of the data in general is described for the individual data in the various parts of the report, and in the appendix. The complete carbon accounting report, with the associated report on methodology from CEMAsys, is available on the Olav Thon Group’s website.
FIGURES FUEL
The data for fuel is an extract from our fuel supplier. It is collected as a single extract for 2021 and grouped by company. We only have data available where the company card has been used at the supplier’s stations. We do not have data available for any other fuel consumption, and consumption is not included in the report in this case.
FOSSIL GAS
There are over 20 suppliers in the Olav Thon Group’s purchasing system for the purchase of fossil gas. Due to the large and dispersed selection, a decision was made to estimate consumption using invoiced sales.
To ensure the most accurate estimation possible, invoices from the top five suppliers (85% of turnover) were analysed. It was discovered that more invoices contained shipping, environmental charges and other costs than pure gas purchases. In the majority of cases, the invoices contained the specified volume of gas. The analysis of the invoices was used to create a calculation model to estimate the volume purchased gas. With varying gas prices and different formats for invoices, attempts have been made to overestimate somewhat rather than underestimate the volume of purchased gas. There are therefore some uncertainties with regard to the figures for fossil gas.
This was done for the first time last year for the 2021 carbon accounting. Price changes throughout 2022 mean that it is no longer correct to use the 2021 rates. A new estimation has therefore been made in this year’s carbon accounting to take this into account.
AIR TRAVEL
A single extract is collected from the travel agency who is the main supplier for air travel in the Olav Thon Group, with information about passenger kilometres per company. If business trips have been booked outside of the travel agency, we do not have data available and this is not included in this report.
FIGURES GENDER AND AGE
The gender and age statistics are taken from Olav Thon Group’s personnel system. The data is therefore based on each individual who worked for at least one of the Olav Thon Group companies in full or in part in 2021. This does not include on-call or extra workers or hired temporary workers. The figures only include employees from companies that are managed by our HR system due to limited access to such data from other companies. The age distribution is calculated based on the year each employee was born and categorised into the three categories up to 30 years, 31–50 years and over 50 years.
The data for gender distribution among managers is taken from the Olav Thon Group’s payroll system in Norway. The system can distinguish between senior manager and middle manager. The number of these is compiled by gender and then a simple percentage calculation of gender distribution for the categories senior manager, middle manager and the overall picture.
In connection with the Olav Thon Group’s sustainability strategy and the goals of 40% of each gender at management levels 1–3, a survey of everyone with a leadership role (personnel responsibility) has been carried out to ensure the correct division of levels. We have assumed that the group management is the top management level (level 1) and worked our way down from there. The definition is based on position rather than person. In other words, where one person has two positions, the top management position was decisive. This is also reflected further down. For example, persons at management level 4 can have a manager who is at management level 3, but also level 2. In this case, management level 2 applies. The person at management level 4 will remain at level 4 despite the fact that the person concerned reports directly to someone at management level 2.
FIGURES EMPLOYEE DEVELOPMENT
The data is taken from our course system and the figures show the number of participations per course. It is difficult to say how many individual people have attended a course. The reason for this is that the system only keeps track of the number of participants per course and not
which persons participated. We can therefore not say anything about gender distribution in these courses either.
In addition, it is also important to point out that several employees also take external courses. We do not have this type of overview.
FIGURES SUPPLIER CHAIN
The figures are based on a Factlines survey conducted in the first quarter of 2021. The Factlines system is used to control and follow up any risk in the Olav Thon Group’s supplier chain.
The survey was sent out to all of Olav Thon Group’s contracted suppliers via the Factlines portal. The response rate was 61%. The survey has two parts, one of which is a standard form based on the ten principles of the UN Global Compact, while the second part is additional questions based on the Olav Thon Group’s own ethical requirements for suppliers.
Part 1 covers the following areas:
• CSR strategy and code of ethics
• Insight into and control of the supplier chain
• The supplier’s self-assessment of the risk in the country where they purchase from
• Management systems in the business
Part 2 covers the following areas:
• Forced labour/slave labour
• Union and collective actions
• Child labour, discrimination and brutal treatment
• Health, Safety and Environment
• Salaries, working hours and regular employment
• Marginalised population groups
• Environment, corruption and animal welfare
Each question gives points based on the importance of the question and the supplier’s answers. Part 1 with standard questions is linked to a risk profile, and each supplier receives a risk profile based on the response to the standard report. This risk profile is of great importance for further follow-up.
70
71
THE OLAV THON GROUP Stenersgata 2a | Postboks 489 Sentrum| 0105 Oslo, Norway Telephone +47 23 08 00 00 | firmapost@olavthon.no | olavthon.no
